HubSpot: the all-around CRM tool par excellence. But it’s possible to make something great even better—and with HubSpot, what better way to do so than by integrating your account with Plecto?
In whatever capacity you want to optimize your efficiency in HubSpot, Plecto can provide you with the tools you need to get the most out of your workflow. Incorporating Plecto dashboards into your HubSpot Reporting feature is the magic key to getting this done.
With this, you’ll have access to live insight-based data reports—leading to increased sales, marketing campaigns with more reach, highly responsive customer service, and more—all in a seamlessly integrated format.
In this article, we’ll go over several of the key HubSpot KPIs you can visualize with Plecto—and later, how to set up the HubSpot x Plecto integration.
KPIs to track in HubSpot
Sales
Average Sales Cycle Length
The mean length of time it takes for your agents to successfully close deals with leads, the Average Sales Cycle Length measures the entirety of the sales cycle through all of its stages: finding, responding to, and qualifying leads; presenting your product; and negotiating and closing the deal. Plecto’s integration with HubSpot supports custom fields, meaning you can visualize these stages in Plecto, regardless of what you call or how you order them. Incorporating your Average Sales Cycle Length as a constant into your forecasting will allow you to establish more consistent sales projections, even with the ups and downs of seasonal variations and market volatility accounted for.

Sales Conversion Rate
How effectively does your team convert leads to sales? This is the question that Sales Conversion Rate answers. The number of won deals in a period divided by the total number of opportunities in a period, the usefulness of this formula extends beyond just sales and leads, as other customer actions (such as ebook downloads and newsletter signups) can be applied under this same framework. Your Sales Conversion Rate is perfect for digging deeper into your data—for example, drilling down this KPI by industry or country. This in-depth analysis will help you determine your ICP (ideal customer profile).

Customer Support
Customer Effort Score
Known as CES for short, Customer Effort Score is based on customers’ answers to one question: “How easy was it for (your company) to address my issue?” Just like its cousins on the KPI family tree, NPS and CSAT, CES is the number of satisfied customers out of the total number being sampled. CES is frequently measured on a 1-7 scale, with 5-7 being considered “satisfied,” but happy/neutral/sad emoticons are a popular alternative scoring system. This KPI is particularly powerful because it measures precisely one parameter of customer satisfaction, one that customers care about a lot: accessing help for their issues with as few steps as possible.

Ticket Backlog
The amount of tickets in the queue you’re waiting to address, Ticket Backlog is something of a “negative” KPI, but it’s still one you really want to keep tabs on. A heavy backlog of accumulated tickets is a surefire way to threaten customer satisfaction, so knowing how many tickets you have to take care of at a given time will help keep your CSAT score high. You can decrease your Ticket Backlog through a variety of strategies, including by organizing your tickets, engaging in ticket cleaning, getting help from automated chatbots, and obtaining additional support staff.

Average Resolution Time
Commonly referred to as ART, Average Resolution Time is the mean length of time it takes for your support staff to resolve customer queries. A very generalized metric, ART can be applied to different channels, whether that’s —phone, live chat, email, and the rest. Therefore, ART gives a good overview of your support team’s relationship with your customers, but it’s important to evaluate ART alongside other, more specific metrics to obtain a clearer picture of how your support systems are functioning individually. Another important thing to remember about ART is to strike a balance between efficiency and quality—while you want to have a low ART, you don’t want to achieve this at the expense of your quality of customer support.

Marketing
Email Open Rate
A vital tool for gauging the effectiveness of your email marketing campaigns, the Email Open Rate KPI measures the percentage of recipients who have opened an email. “Effectiveness” can be broken down into subcategories including engagement, deliverability, and audience interest. A common way to increase your Email Open Rate is by using A/B testing to determine which subject lines, sending times, and audience segments are most conducive to your email marketing efforts.
Conversion Rate of Sessions to Orders
While typically used in the B2B sector, HubSpot’s offering for e-commerce companies is growing. Often used alongside platforms like Shopify, the growing complexity of the e-commerce industry means that keeping tabs on your KPIs is a must.
Sessions to Orders Conversion Rate is one of the important e-commerce KPIs. It measures the number of website visitors against the number of people who actually make a purchase on your website. Therefore it’s a good test of your website’s UX (user experience).
How intuitive is the website for the user to navigate? Have you advertised enough on your website? Are visitors following through with making purchases in their shopping carts, or abandoning them before purchasing? A low Sessions to Orders Conversion Rate could indicate there is an issue with one of these components, so it’s a good idea to measure this KPI in conjunction with other ones that are more specific.

Number of Leads Created
While it’s pretty self-explanatory, this fact doesn’t diminish its importance. If anything, it only highlights how important the Number of Leads Created is to your marketing efforts. Whether you measure this KPI based on a marketing campaign, a particular channel, or a time period, your Number of Leads Created indicates your potential of obtaining clients in the near future.
The key word here is potential, as nothing is set in stone yet! With this in mind, use this KPI as a starting point rather than an end goal. Once you obtain the leads, it’s time to reel them into closing the deal, through strategies such as targeted ads and personalized content.
Build your first dashboard.
Start your 14-day free trial today
Email Click-through Rate
Email Click-through Rate, or Email CTR, measures the percentage of delivered emails that were clicked on at least once. For example, if you send out 1000 emails in a marketing campaign, 800 are delivered successfully, and 50 got at least one click from a recipient, your CTR is 50/800, or a (pretty impressive!) 6.25%.
Usually Email CTR tends to be quite lower, hovering around 2.6–4.8%, depending on the industry. Using Email CTR gives you direct insight on whether your emails prompt direct action, and therefore provides an important indicator about the overall success of your email marketing strategy.
To improve your CTR, you can run A/B testing to find the best CTA (calls to action) for customers to obtain your product or service, and experiment with placement of ads, photos, and personalized content on your emails.
Customer Acquisition Cost
Calculating your company’s total costs needed to obtain a new customer within a given period, Customer Acquisition Cost (CAC) is an extremely important metric for tracking sales growth. You can think of it as a ROI metric specifically intended to measure how you obtain new customers, with your “investment” being ad spend, marketing tool subscriptions, promotional materials, and salaries that go into expanding your customer base. With Plecto, you are able to take the deal sizes from HubSpot and calculate CAC with your ad spend from different platforms like Google Ads and Facebook Ads.

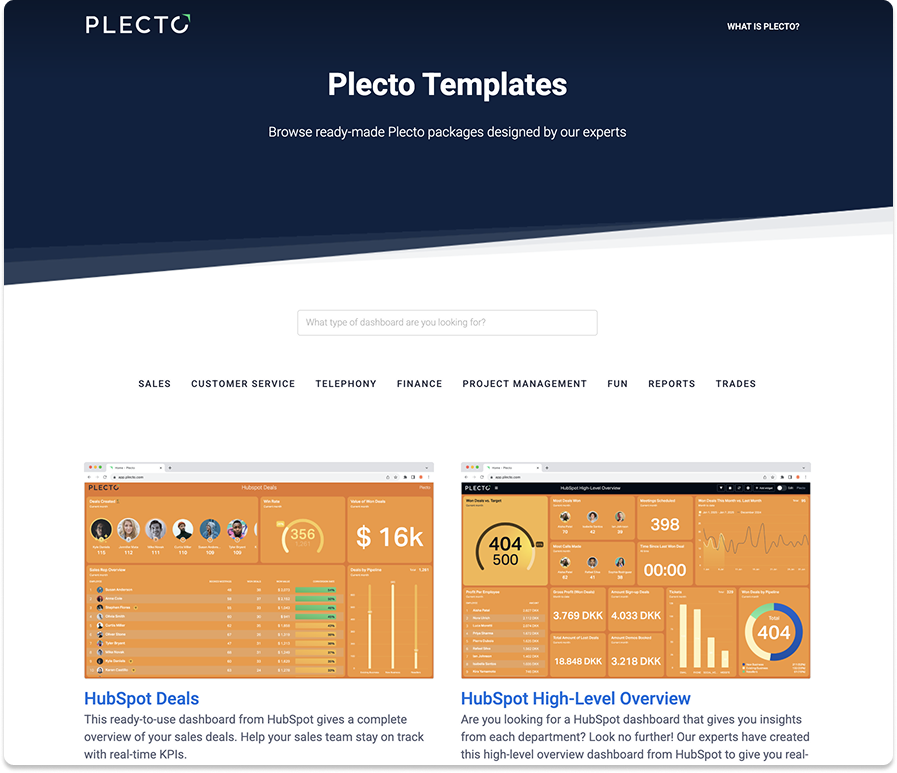
The Plecto Store and dashboard templates
To make your HubSpot x Plecto integration even easier, Plecto has created several dashboard templates with widgets for the KPIs we’ve listed here, and more. You can access these templates in the Plecto Store, saving you valuable time and making your life easier—especially if you’re new to either Plecto or HubSpot!
Within the Plecto dashboard builder, you also have the option to select HubSpot-specific formula templates for your widgets. Once again, this can save you a lot of time and energy trying to create formulas if you’re a new HubSpot user.
How to import Plecto dashboards into HubSpot
Did you know that HubSpot has a handy embedding feature?
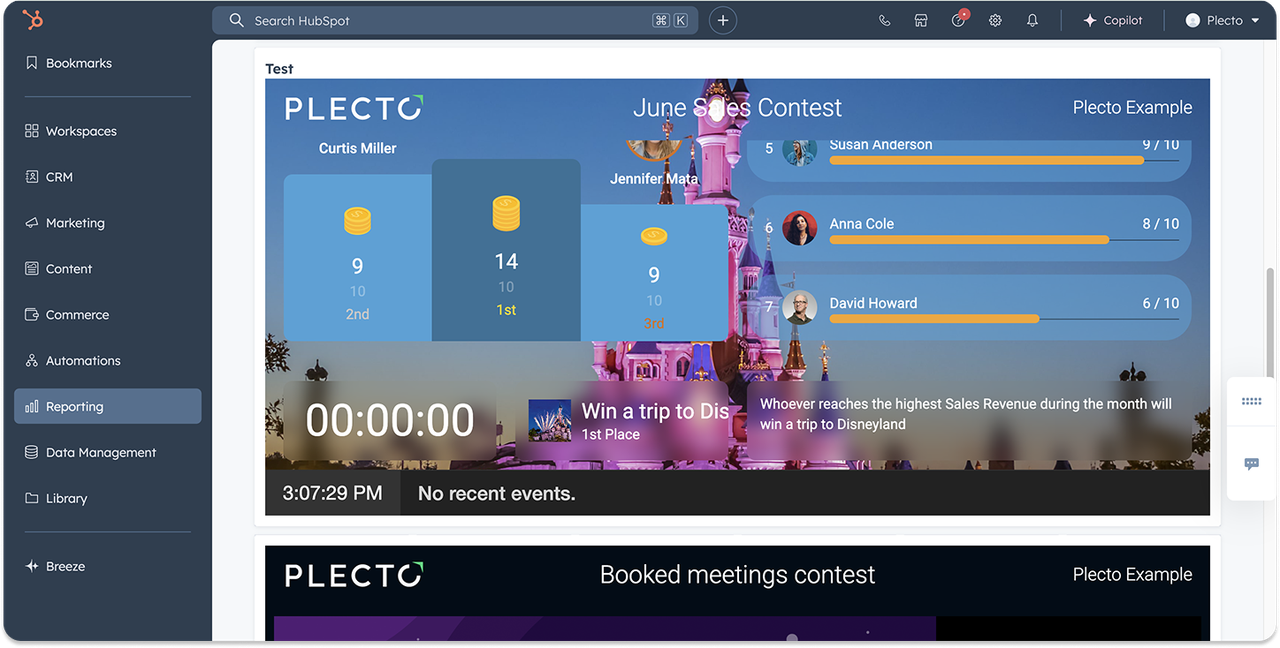
In the Reporting section, you’ll find a section dedicated to displaying data from HubSpot’s integrations (including Plecto), as well as HubSpot’s native dashboards, reports, and analytics tools. If you want to access your Plecto dashboards within HubSpot, the following guide will explain how to do it. Thankfully, it’s only a few easy steps.
First, create a slideshow in your Plecto account.
In Plecto, locate the Slideshow tab on the left-hand menu (under Visualization). This will open the Slideshow page. Once there, click New Slideshow, located in the upper-right corner. Give your new slideshow a name and click on Add dashboard slide to choose the dashboard you want to connect.
You can add as many dashboards as you like—each will appear on a different slide—and adjust the display times for each slide. Click Save in the bottom right once done.
Second, create a public URL for your slideshow.
The Create public URL tab is located in the bottom right of the page, and will automatically generate a URL for you. Copy this link.
Third, embed your slideshow in HubSpot.
On the left-hand menu in HubSpot, locate the Reporting tab and open Dashboards. Click Actions in the upper-right corner and select Add external content. This will open a new window with several platforms to import data from. Select Other content, and paste your URL from Plecto in the URL or embed code box. Click Add once done.
And that’s it! Congratulations—you’ve imported your data into HubSpot, and now have full CRM access to all of your dashboards in one spot.
Remember! All edits and modifications to Plecto dashboards can only be made in Plecto—HubSpot is simply the platform you embed in.
Conclusion
Integrating your HubSpot data into Plecto is one of the best ways to enhance the effectiveness of your CRM operations. Using Plecto's live KPI dashboards in HubSpot’s Reporting feature allows your company, organization, or team to obtain real-time insights that will help increase your performance and make data-informed decisions.
With the data accessibility and transparency provided by Plecto x HubSpot, you’ll make more sales, engage in more impactful marketing campaigns, and practice more responsive customer support. Overall, with this powerful CRM integration, you’ll maximize your ability to manage your all-important customer relationships—the foundation for any successful business enterprise.
So why wait? Learn what a HubSpot x Plecto integration can do for you, and sign up for a free 14-day Plecto trial today!
JAMES NIILER
Content Writer