 Sign in

The 10 Best SaaS KPIs You Need to Track in 2026
SaaS metrics and KPIs for 2026: the 10 to track, from MRR, ARR and churn to CAC, CLV and NPS, plus NRR, LTV:CAC and Rule of 40 with formulas.
What are SaaS metrics, and how are they different from SaaS KPIs?
SaaS metrics are the numbers a subscription business uses to measure revenue, customer retention and the cost of growth. SaaS KPIs are the few metrics tied directly to your goals, such as MRR, churn rate and CAC. Every KPI is a metric, but only the metrics that drive decisions deserve KPI status.
A SaaS metric is any figure you can measure: signups, trial conversions, support tickets, server costs. A Key Performance Indicator (KPI) is a metric you have chosen to manage against a target and review on a fixed cadence. Subscription businesses can measure dozens of SaaS metrics, and tracking all of them is neither productive nor realistic. Without a way to combine and visualize them, it quickly becomes impossible to see which numbers matter.
That is why this guide starts with 10 SaaS KPIs that most subscription teams should monitor and analyze, ideally on a single SaaS KPI dashboard. It then adds four SaaS metrics you will need as you scale: net revenue retention, the LTV:CAC ratio, CAC payback and the Rule of 40. For every KPI you get a definition, a formula and what the number tells you.
These are the 10 most important SaaS KPIs to focus on:
The 10 SaaS KPIs at a glance
| SaaS KPI | What it measures | Formula |
|---|---|---|
| Churn Rate | Percentage of total customers lost in a period | (Customers lost / Customers at start) × 100 |
| MRR | Monthly income expected from paying customers | Number of customers × ARPU |
| Revenue Churn Rate | Recurring revenue lost to cancellations or downgrades | (Lost recurring revenue / Recurring revenue at start) × 100 |
| ARR | Annual recurring income from paying customers | MRR × 12 |
| CMRR | MRR adjusted for bookings, cancellations, and downgrades | MRR + new bookings − expected cancellations and downgrades |
| OCF | Cash generated by operations over a period | Net income + non-cash expenses − increase in working capital |
| LVR | Month-over-month growth in qualified leads | ((This month's leads − last month's) / last month's) × 100 |
| CAC | Total cost to acquire one new customer | (Sales + marketing costs) / New customers acquired |
| CLV | Total income expected from a customer over their lifecycle | Customer value × Average customer lifespan |
| NPS | Customer loyalty, based on promoters vs. detractors | % Promoters − % Detractors |
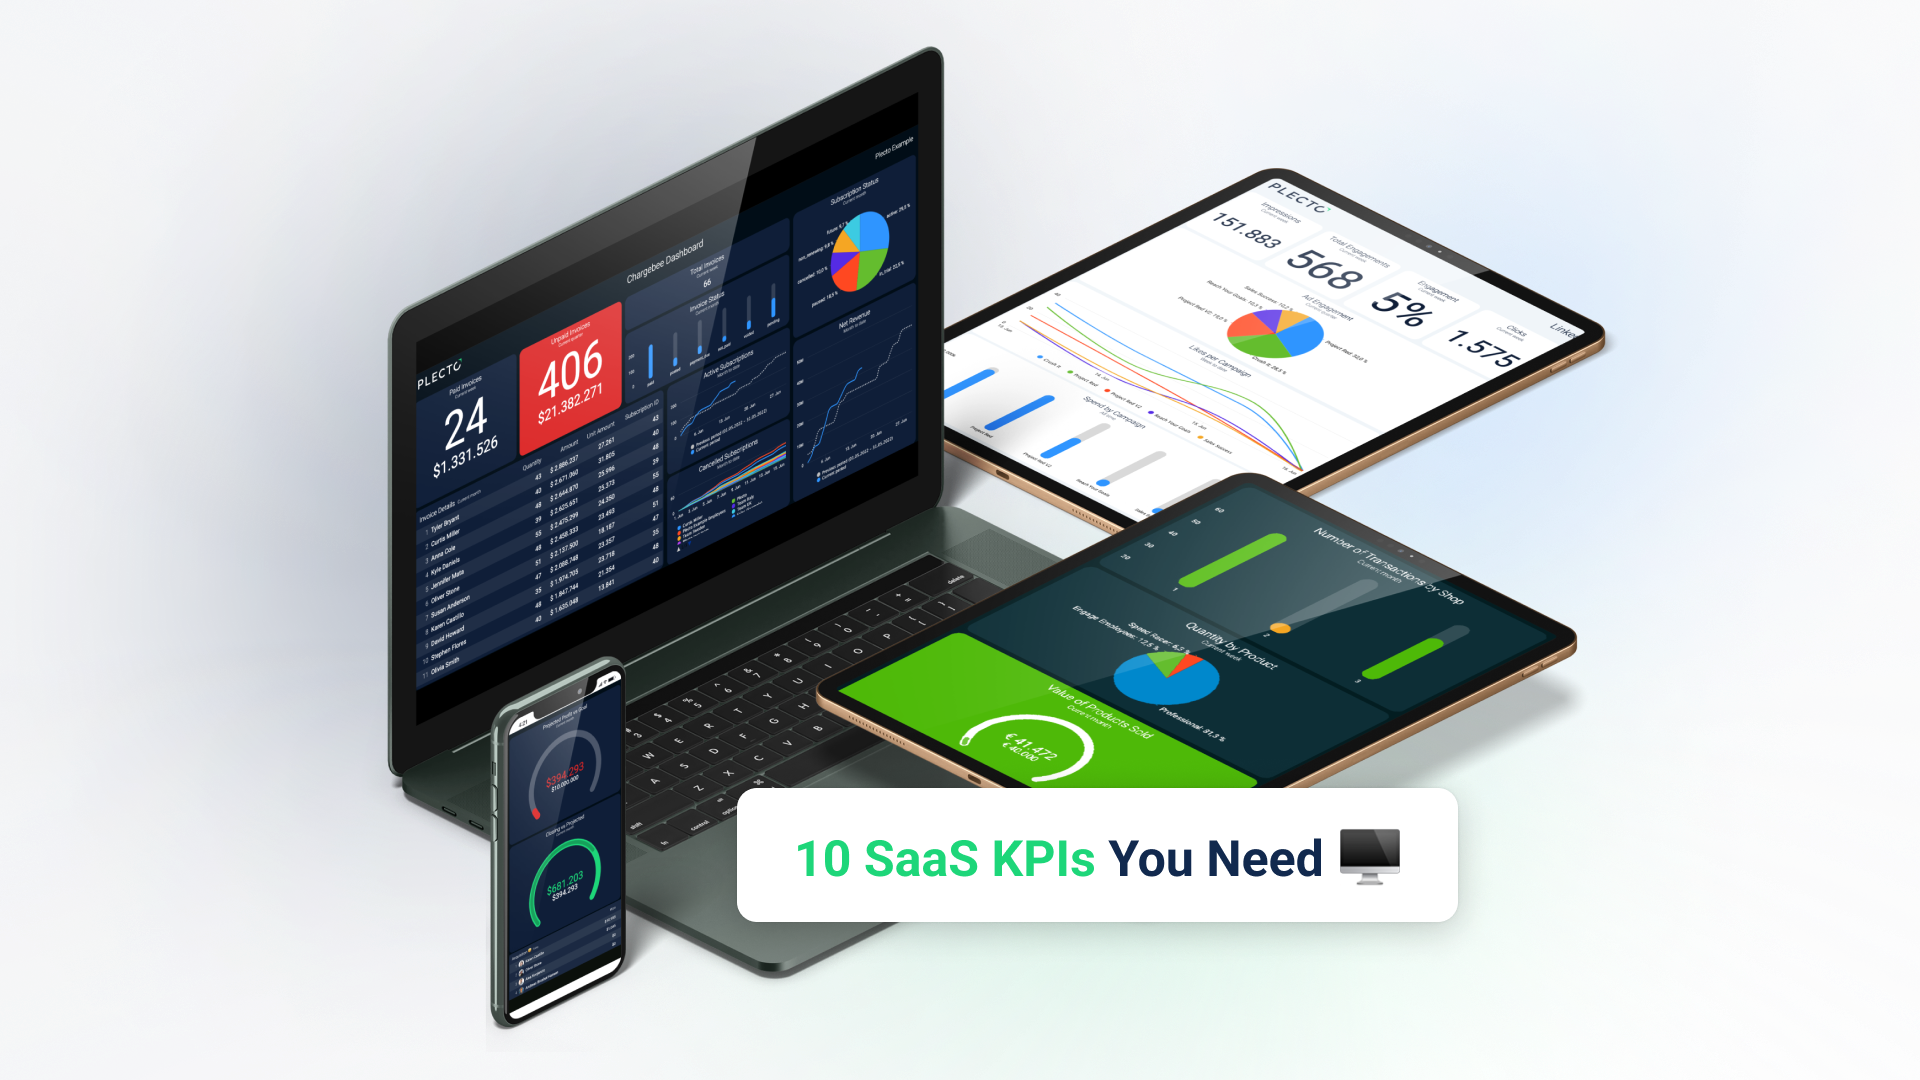
You can track all ten on a single SaaS KPI dashboard that updates in real time.
 Real-time Plecto dashboard for tracking SaaS metrics and KPIs
SaaS metrics by category
Grouping SaaS metrics by the question they answer makes it easier to pick a balanced set. Most teams need at least one metric from each row, and a KPI dashboard should show a handful, not all of them.
| Category | Question it answers | SaaS metrics to track |
|---|---|---|
| Growth and revenue | How fast is recurring revenue growing? | MRR, ARR, CMRR, new MRR |
| Acquisition | How efficiently do we win customers? | LVR, CAC, CAC payback |
| Retention | Are customers staying and expanding? | Churn rate, revenue churn rate, net revenue retention, gross revenue retention |
| Unit economics | Does each customer pay back the cost of winning them? | CLV, LTV:CAC ratio, CAC payback |
| Customer satisfaction | Are customers happy enough to stay and recommend us? | NPS |
| Cash and efficiency | Can we fund growth sustainably? | OCF, Rule of 40 |
The ten numbered sections below cover the core SaaS KPIs. Net revenue retention, gross revenue retention, the LTV:CAC ratio, CAC payback and the Rule of 40 follow after number 10.
1. Churn Rate
Churn Rate is the percentage of total customers lost in a period.
The first one is, perhaps, the most obvious. However, that doesn't always mean that SaaS companies remember to check up on it. For a SaaS distributor or any other company that works with subscribers, customer churn rate is essential since it shows the percentage of customers or subscribers lost.
Too many SaaS businesses choose to overlook this number in favor of more detailed or derivative metrics — and that's a huge mistake. The most important thing for every SaaS company is to retain existing customers while also onboarding new ones. If your typical customer does not stick around long enough for you to earn back what you spent to acquire them (CAC), then you're in trouble. The logic here is pretty straightforward: If you want to create revenue growth, then it is equally important to maintain your existing customers and acquire new ones. For ways to bring the number down, see our guide to SaaS customer retention.
Here's how you can calculate your churn rate:
Find your Churn Rate by dividing the number of customers lost in a period by the number of customers at the start of the period.
Formula: Churn Rate = (Customers lost in period / Customers at start of period) × 100

2. MRR: Monthly Recurring Revenue
MRR refers to the amount of income a company can expect to earn from paying customers every month.
Monthly recurring revenue (MRR) is a simple but powerful SaaS metric that tracks new sales, upsells, renewals, and churn every month. If churn is not the most important KPI for your company, then MRR certainly is. Growing SaaS companies tend to lose sight of their secured monthly revenue flow and focus on bookings and one-off revenue instead.
Monthly recurring revenue has many significant business benefits. It keeps the focus on the present, shows how quickly the business is growing, and helps you prioritize long-term contracts over short-lived ones. If you want to see how MRR is built and tracked in practice, read our MRR KPI guide.
Use the following formula to calculate MRR:
Find MRR by multiplying the number of customers by ARPU (average revenue per user).
Formula: MRR = Number of customers × ARPU

3. Revenue Churn Rate
Revenue Churn Rate is the percentage of recurring income a business loses over a period due to customer cancellations or downgrades.
More important to track than the customer's churn rate is the revenue churn rate. This KPI essentially measures your company's loss of revenue, while also evaluating the outside impact some customers might have over others.
This KPI is particularly critical if you operate with a variable subscription price that is dependent on the number of licenses a customer pays for. You will notice some particular correlations between customer churn rate and monthly revenue churn rate.
However, there is likely to be some variation among buyers that generate more revenue than others. It's for this reason that you should track MRR and churn rate jointly so that you can dedicate your efforts toward keeping your most valuable customers!
At a minimum, you should be tracking your revenue churn rate quarterly. But if you really want to optimize your revenue, aim to calculate this KPI monthly!
Plecto's Churn MRR KPI shows the recurring revenue lost to cancellations each month.
To find your Revenue Churn Rate (gross), divide your lost revenue by your revenue at the start of the period. Multiply by 100 to obtain a percentage.
Formula: Revenue Churn Rate = (Lost recurring revenue / Recurring revenue at start of period) × 100
4. ARR: Annual Recurring Revenue
ARR is the amount of recurring income from paying customers a company can expect to earn over a year.
This is essentially just an extended version of the second KPI on the list, MRR. Is that cheating, or is it just being efficient? We'll let you decide!
You can calculate annual recurring revenue (ARR) by multiplying your MRR by 12 months (see the ARR KPI for how it is tracked). Some SaaS businesses choose to calculate their MRR and ARR manually, but most companies nowadays have a system that calculates SaaS metrics in real-time.
Recurring revenue is what makes the SaaS business model so enticing to founders and investors. Customers will continue to pay you as long as you make them happy by providing value through your service. When it comes to determining prices in new companies, instead of settling on one price and locking it in, try different prices each quarter and adjust according to what worked best. That way, you can be certain about how much your customers value your business, and ascertain their satisfaction with your product — ultimately so that your SaaS company can keep on growing.
Here's the formula to calculate ARR:
To find ARR, multiply your MRR (number of customers x ARPU) by 12.
Formula: ARR = MRR × 12

5. CMRR: Committed Monthly Recurring Revenue
CMRR is a variant of Monthly Recurring Revenue that accounts for bookings, cancellations, and downgrades.
A modified version of MRR is committed monthly recurring revenue (CMRR). The difference between MRR and CMRR is that the former refers to the total revenue expected from customers every month, whereas the latter takes into account new bookings, cancellations, and downgrades.
Ultimately this KPI aims to show what a SaaS company's revenue would be in the future if the business halted its sales and marketing efforts. It is a particularly useful metric for forecasting future revenue and gives SaaS companies a much clearer picture of their company's financial climate than other more standard revenue metrics.
CMRR is calculated by taking your existing MRR (aka from last month), adding new known bookings, and subtracting known cancellations and downgrades. In this regard, CMRR provides a better picture of a SaaS company's actual financial position than MRR since it also calculates anticipated churn for the time period you are measuring.
Since MRR does not account for expected cancelations, upgrades, and downgrades, it is better for providing a gross overview of revenue — so you can use either MRR or CMRR depending on what it is you are seeking to achieve.
For SaaS companies who sell their subscriptions annually, this metric could be adjusted to calculate committed yearly recurring revenue (CARR).
To find CMRR, add the monthly value of signed contracts to your MRR, and subtract expected losses.
Formula: CMRR = MRR + new signed bookings − expected cancellations and downgrades
6. OCF: Operational Cash Flow
OCF is the amount of cash generated by a company's operations over a period.
Often overlooked, this metric may seem simple but money is one of the more exciting KPIs for SaaS businesses. "Why," you ask?
Well, because it takes time and funding to come up with a great product and the repayment on that investment will occur over a long time. SaaS founders, like most other companies, must be aware of their cash reserves. If they fail to do so, then they're going to end up overspending, and the company may need outside financing to survive.
Cash can be a difficult KPI to track — particularly in B2B where most transactions are recurring invoices or based on subscription services. Nonetheless, it's crucial to keep on top of your cash flow and understand fluctuations.
Whether it's a metric like cash or a KPI requiring complex calculations, you will gain incredibly beneficial insights into your individual, team, and business performance by measuring your most important metrics. So, they need to be understood by those using them — and most beneficial when visualized!
Here's the formula for a common cash-focused metric, OCF (Operational Cash Flow):
To find OCF, add your net income and non-cash expenses. Subtract your increase in working capital from this result.
Formula: OCF = Net income + non-cash expenses − increase in working capital

Too many companies choose to keep their data secret and only discuss it within management. This is the first mistake. After all, how can you expect your employees to take responsibility for their performance when they don't even know how they're performing?
The leading companies are those that are transparent and open about their KPIs and business performance — drawing their employees' attention to them and presenting them in a comfortable and useful way. This is what we do here at Plecto!
One such way of doing this is by using custom-made dashboards that make complex data easy to understand by presenting your most important KPIs in visual forms like tables, pie charts, and graphs. It's important to remember that you should only should relevant KPIs in an easily digestible way, so your employees don't get overwhelmed and confused.
The following is an example of a data visualization dashboard you can customize to show all your important KPIs to the people you want to see them!
 Example Plecto KPI dashboard that can be adapted to track SaaS metrics
7. LVR: Lead Velocity Rate
LVR measures the month-over-month percentage growth in qualified sales leads.
Executives of a SaaS company need to look at the future income possibilities. Lead velocity rate (LVR) is a metric that quantifies your business' growth in terms of qualified leads. That is, how many potential customers are currently in your pipeline to convert to actual customers.
The general problem with most sales metrics is that they are historical (based on old data). Who wants to be focusing on outdated data when you need to make actionable decisions that will gain you that competitive advantage.
This is why LVR is an important KPI you should be focusing on if you want to propel your team's performance to new heights!
LVR is calculated as a percentage, and factors in the variation in qualified leads across different time periods.
Find LVR by subtracting the number of last month's leads from the number this month's leads. Divide the result by the number of last month's leads. Multiply by 100 to obtain a percentage.
Formula: LVR = ((This month's leads − last month's leads) / last month's leads) × 100
8. CAC: Customer Acquisition Cost
CAC measures the total cost it takes to acquire one new customer.
Now, not all metrics in this blog post are exclusive to SaaS companies, but that certainly doesn't detract from their value — they simply should be used to best suit your company's business goals, challenges, and needs. Customer acquisition cost (CAC) is no exception.
This valuable KPI measures the cash that a business spends to acquire new customers. CAC indicates how long it will take a company to earn a return on the investment it took to acquire those customers — a metric known as the CAC payback period.
CAC takes into account the amount companies spent on sales, marketing, overheads, and any other associated costs of growing their clientele. So, this KPI can help SaaS companies assess their spending, and whether they can afford increases in marketing spending, for example.
In fact, this metric can help to determine future business goals and activities since it could indicate that a change in price, more sales, or expense cutbacks are necessary. Ultimately CAC speaks to a company's economic viability and efficiency.
Calculating CAC involves dividing all marketing expenses, personal salary, sales costs, etc. spent on acquiring customers by the number of customers acquired during the tracking period. The formula is as follows:
Find CAC by adding together the costs of sales and marketing, and dividing by the number of new customers acquired.
Formula: CAC = (Sales + marketing costs) / New customers acquired

9. CLV: Customer Lifetime Value
CLV is the total income from a customer a business expects to earn over the customer's lifecycle.
Now that you know what CAC is and why you should measure this metric, it's time to turn your focus to customer lifetime value (CLV). This KPI reflects the total income a business can expect to earn from a customer over the entire duration of their business relationship.
When tracking CLV, you should keep an eye on CAC, too. A SaaS company's CAC should never be higher than its average CLV. If it is, the business spends more to win a customer than it earns from them.
CLV is a more advanced way to look at a SaaS company's finances that often relies on other KPIs to calculate it. You need your customers' average revenue per period, gross margin and average lifespan. It can get complicated, but the main thing to remember is that CLV must be comfortably higher than CAC. The LTV:CAC ratio, covered after number 10, shows how to measure that.
To get there, use the following formula to calculate your CLV:
Find CLV by multiplying the customer value by average customer lifespan.
Formula: CLV = Customer value × Average customer lifespan
Rule of thumb: CLV should be at least about 3× CAC, and CAC should never exceed CLV.

10. NPS: Net Promoter Score
NPS measures customers' overall loyalty to your business, based on a promoter/passive/detractor division.
Unlike financial metrics, the Net Promoter Score (NPS) is a standardized market research metric that quantifies your customer's satisfaction and loyalty. The official NPS format involves asking your customers the single survey question, "How likely would you be to recommend our company, product, or service to a friend or colleague?" Respondents are then divided into groups — promoters, detractors or passives — based on their response to this question based on a scale from 0 (not at all likely) to 10 (extremely likely).
NPS takes into account only promoters and detractors. Promoters are those who respond with a score of 9 or 10, and are generally your more loyal customers who may refer others to try your product, service, or company. Detractors are those that respond with a score of 0-6, and are typically assumed to be dissatisfied customers who are unlikely to purchase from you again, perhaps even to the extent that they discourage others from purchasing from you.
To find NPS, subtract the percentage of detractors from the percentage of promoters.
Formula: NPS = % Promoters − % Detractors

Here's an example:
If 20% of respondents are detractors, and 65% of respondents are promoters, your NPS score would be 65-20 = 45.
Measuring NPS is one way SaaS companies can quickly find out which customers are dissatisfied with their product or experience. In this sense, either good or bad scores, the insights gained from asking your customers for feedback has the potential to save you considerable revenue that otherwise would have been lost to churning customers.
Many SaaS companies shy away from asking for feedback, but it's ultimately this score of customer satisfaction that allows businesses to make appropriate improvements to their product or customer experience before it's too late. So don't be afraid to send out that marketing email asking for Capterra reviews or direct feedback from your customers!
In the early stages of a new business, there may not be enough customers for an NPS score to reflect the actual sentiment. Instead, the qualitative data you obtain from your NPS can be used to clarify whether there is a suitable product/market fit. The key takeaway when it comes to NPS: the higher the score, the better!
 Plecto sales activities dashboard showing SaaS metrics alongside sales KPIs
Four more SaaS metrics to track as you scale
The ten KPIs above cover the basics. Once you have them in place, these four SaaS metrics combine them into the ratios that investors, boards and finance teams usually ask for.
SaaS metrics for retention: net and gross revenue retention
Net revenue retention (NRR) shows how much recurring revenue you keep and grow from existing customers over a period, including upgrades. Gross revenue retention (GRR) shows the same thing without upgrades, so it can never exceed 100%.
Both exclude revenue from new customers. NRR above 100% means expansion from existing customers more than covers churn and downgrades. GRR tells you how leaky the bucket is, and NRR tells you whether upsells are filling it.
Formulas:
NRR = ((Starting MRR + expansion MRR − contraction MRR − churned MRR) / Starting MRR) × 100GRR = ((Starting MRR − contraction MRR − churned MRR) / Starting MRR) × 100
Example: you start the month with $100,000 MRR, gain $8,000 from upgrades, lose $2,000 to downgrades and $4,000 to cancellations. NRR is (100,000 + 8,000 − 2,000 − 4,000) / 100,000 = 102%. GRR is (100,000 − 2,000 − 4,000) / 100,000 = 94%.
Track both by cohort or customer segment if you can. For tactics that move these numbers, see our guide to SaaS customer retention.
LTV:CAC ratio: the SaaS metric that checks unit economics
The LTV:CAC ratio compares what a customer is worth over their lifetime with what it cost to win them. LTV is the same as CLV from number 9, so the formula is simple.
Formula: LTV:CAC = Customer lifetime value / Customer acquisition cost
A common rule of thumb is a ratio of about 3:1 or higher. A ratio near 1:1 means you barely recover your acquisition spend. A very high ratio can mean you are under-investing in growth. Treat the rule of thumb as a starting point, because the right ratio depends on your margins, sales cycle and payback period.
CAC payback period
CAC payback shows how many months it takes to earn back the cost of acquiring a customer from the gross profit that customer generates. It is the cash-flow view of the CAC you calculated in number 8.
Formula: CAC payback (months) = CAC / (Average MRR per new customer × gross margin %)
Example: if CAC is $6,000, a new customer pays $500 per month and your gross margin is 80%, payback is 6,000 / (500 × 0.8) = 15 months. Shorter payback frees cash to reinvest in growth. What counts as acceptable differs between self-serve and enterprise sales, so compare against your own history and segment.
Rule of 40: balancing SaaS growth and profit
The Rule of 40 says a healthy SaaS company's revenue growth rate plus its profit margin should add up to at least 40%. Teams usually use EBITDA margin or free cash flow margin for profit, so state which one you use.
Formula: Rule of 40 score = Revenue growth rate % + Profit margin %
Example: 30% growth plus a 15% margin gives a score of 45%. The Rule of 40 is a rough guide, mostly applied to scaling companies. Early-stage companies often score below 40 on purpose while they invest in growth.
How to track SaaS metrics on a dashboard
Knowing the formulas is one thing; watching them move is another. Teams that act on SaaS metrics put them on a SaaS KPI dashboard that updates automatically instead of a monthly spreadsheet. A practical setup looks like this:
- Pick a short list of metrics. Use the category table above, keep it to three to five metrics per audience, and cover the categories that matter most at your stage, starting with MRR, ARR and churn.
- Connect the systems that hold the data. Billing data can come from Stripe or Chargebee, pipeline data from HubSpot or Salesforce, and support data from Zendesk Support. Plecto has 150+ integrations.
- Calculate derived metrics with formulas. Ratios such as churn rate, LTV:CAC and CAC payback can be built as custom KPIs from the underlying numbers.
- Share them where the team works. Put the dashboard on an office screen or share it with managers, so everyone sees the same numbers. Our TV dashboards guide explains how.
See Plecto's SaaS KPI dashboards →
Track These 10 SaaS KPIs on a SaaS KPI Dashboard with Plecto!
And there you have it — the 10 SaaS KPIs every SaaS manager and entrepreneur should be measuring this year.
Whether you are an early-stage startup or a scaling business, measure the SaaS metrics that contribute most to your growth. While this is a great place to start, to see actual results, you need to actually use this data! There's no point in tracking these metrics if you're not going to do anything about them.
The best way to do this is to centralize all your KPI data you're tracking from your telephony, sales, support, and marketing software and systems. Then visualize them on data dashboards that transform this complex information into easy-to-understand charts that your employees can actually use!
Sign up for a 14-day free trial with Plecto, start visualizing your most important KPIs on data dashboards, and skyrocket your SaaS company targets starting today!
FAQ
Frequently asked questions
SaaS KPIs are the metrics a subscription business tracks to measure growth, retention, and revenue, including churn rate, monthly recurring revenue (MRR), annual recurring revenue (ARR), customer acquisition cost (CAC), customer lifetime value (CLV), and net promoter score (NPS). They turn raw SaaS metrics into a short list you manage against targets.
SaaS metrics are all the measurable numbers in a subscription business, from signups to support tickets to revenue. SaaS KPIs are the small subset of those metrics you tie to goals and targets and review regularly. Every KPI is a metric, but most metrics are not KPIs.
Most SaaS teams start with churn rate, MRR, and the balance of CAC against CLV, then add ARR, revenue churn, net revenue retention, and NPS as they scale. Track a focused handful that map to your goals rather than every SaaS metric available.
MRR is monthly recurring revenue, the predictable income from subscriptions in a month. ARR is the annual equivalent, calculated as MRR multiplied by 12. Teams with monthly plans usually report MRR, while teams selling annual contracts often report ARR to describe the size of the business.
A common rule of thumb is a customer lifetime value of about three times customer acquisition cost or more, and CAC should never exceed CLV. If it does, you are spending more to win a customer than they are worth. Check payback time and margins alongside the ratio.
Take your starting MRR, add expansion revenue from existing customers, subtract downgrades and cancellations, then divide by the starting MRR and multiply by 100. Revenue from new customers is excluded. A result above 100% means upgrades from existing customers outweigh the revenue you lost.
The Rule of 40 says a healthy SaaS company's annual revenue growth rate plus its profit margin should total at least 40%. Companies usually use EBITDA or free cash flow margin for profit. It is a rough guide for scaling companies, not a target every early-stage business should hit.
Pull them from your billing, CRM, and support tools into a SaaS KPI dashboard that updates automatically, so the numbers stay visible to the whole team in real time rather than buried in a monthly spreadsheet. Start with three to five metrics per audience, and use formulas for ratios such as churn rate or LTV:CAC.
Start your 14-day free Plecto trial today.
Enjoyed the article? Share it:


CHRISTOPHER MADSEN