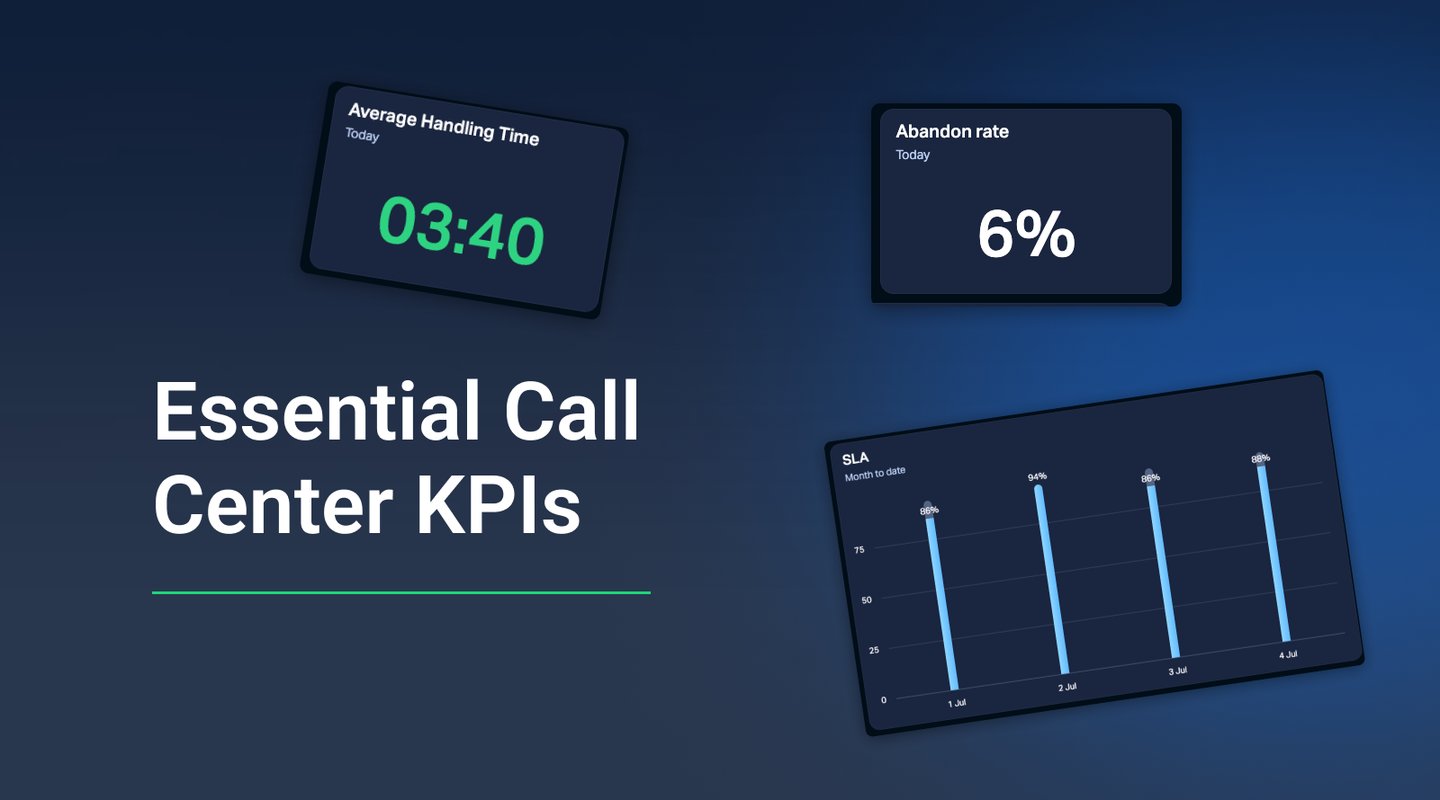
Tracking the right call center KPIs is an important step toward measuring your call center’s effectiveness, identifying areas in need of improvement, and making data-driven decisions that can improve your employees’ skills, make their jobs easier, and empower them to provide higher standards of service.
Read on to find 10 call center KPI examples that are proven to uncover the insights you need to measure your team’s performance – and make decisions that will produce noticeable results.
10 Call Center KPI Examples
Tracking the right KPIs for call center excellence doesn’t mean setting impossible goals that create unnecessary stress and anxiety for front-line agents. These ten call center KPI examples are a solid starting point for establishing and communicating measurable customer service goals to keep your team focused on providing top-notch service – and help you to identify and solve their day-to-day challenges, and recognize their victories. Here are the 10 KPIs that are essential to your contact center operations:
- Average Customer Satisfaction Score (CSAT)
- Net Promoter Score (NPS)
- Average Handling Time (AHT)
- Service Level (SLA)
- Average Wait Time/First Response Time (AWT/FRT)
- Average Abandonment Rate
- First Contact Resolution (FCR)
- Average Time to Resolution
- Employee Turnover Rate (ETR)
- Cost per Call (CPC)
So, without further ado, let's dive deeper into each of the KPIs.
1. Average Customer Satisfaction Score (CSAT)
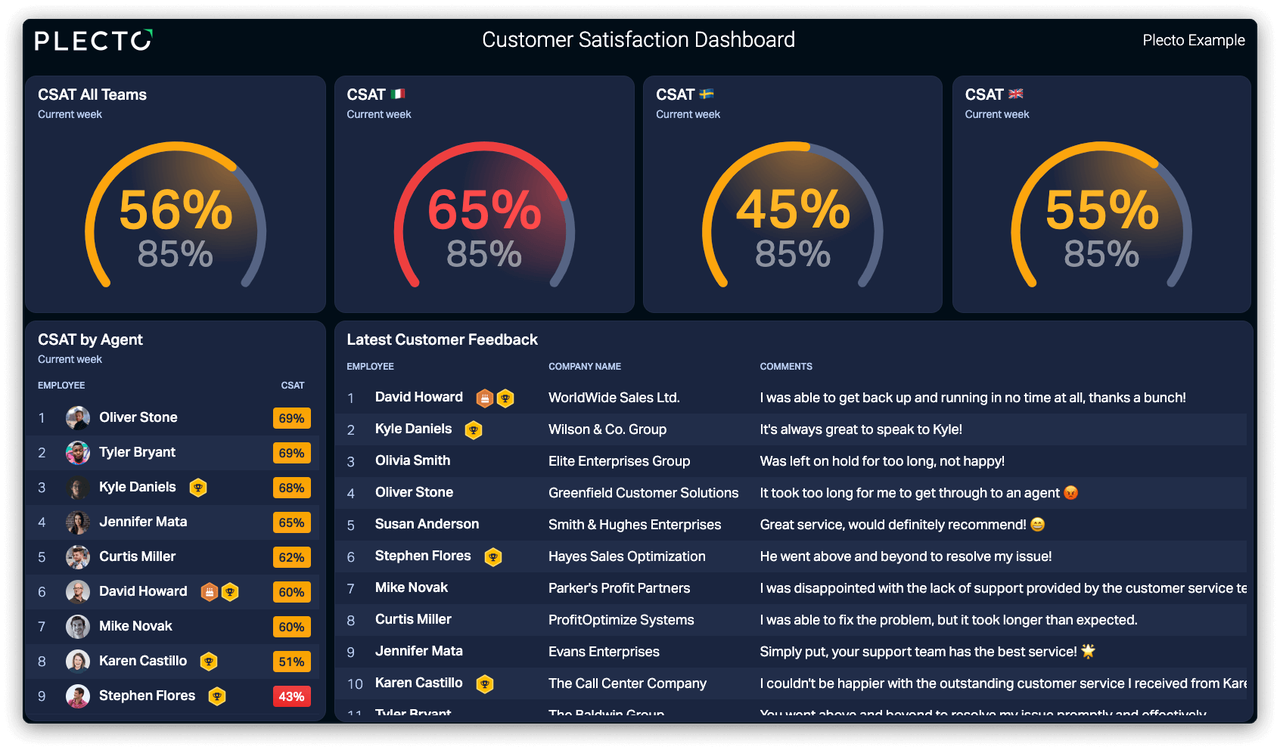
This is arguably the most important of all the call center KPI examples on our list, and that’s why we’ve put it first. We’re leading with this one because none of the other call center KPIs matter if most of your customers are dissatisfied. CSAT measures how well your service met the customer’s expectations. It’s measured based on one question: On a scale of 1–5 how satisfied were you with our service today?
This is the formula to calculate CSAT:
CSAT Score = (Number of Positive Ratings (i.e., 4 or 5) / Total Number of Responses) x 100
Here are some current industry CSAT benchmarks for phone support:
- High: 95%
- Average: 87%
- Low: 76%
2. Net Promoter Score (NPS)
Before we get into the nitty gritty of call center KPIs, let’s talk about NPS, which is an important counterpart to CSAT. Going a level deeper than CSAT, NPS measures customer loyalty based on how likely the customer is to recommend a company or product to others. Like CSAT, NPS is measured based on one question: On a scale of 1–10, how likely are you to recommend us to a friend?
Generally, customers fall into three groups:
- Detractors: 0–6
- Passives: 7–8
- Promoters: 9–10
This is the formula to calculate NPS:
Net Promoter Score = Total Percentage of Promoters – Total Percentage of Detractors
3. Average Handling Time (AHT)
Now, let’s get into some more granular call center KPIs. AHT is an important metric for assessing your call center’s efficiency. It measures the average amount of time it takes to handle a call from start to finish – including navigating phone menus, hold time, talk time, and post-call administrative work. Customers want their issues resolved quickly, and companies want to minimize their support costs.
Keeping the AHT to a minimum can be a win all around because customers will be appreciative of the company’s efficient service while the call center team will be able to serve the maximum number of customers in the least amount of time. However, it’s important not to sacrifice thoroughness for speed – placing too much emphasis on efficiency could backfire if the quality of service suffers.
Average Handing Time = (Total Talk Time + Total Hold Time + Follow-up Time) / Total Number of Calls
4. Service Level
The second of our call center KPI examples is essential to assessing whether the call center is meeting customers’ expectations for prompt service. Service level tracks the percentage of calls that are answered within a target timeframe, which is often measured in seconds. A common service level target is “80/20,” which refers to answering 80 percent of calls in under twenty seconds. How long a customer spends on hold before speaking with an agent has been shown to directly impact their level of satisfaction with the service they receive. Research shows that 60% of customers feel that holding for even one minute is too long. A high service level indicates that the call center is adequately staffed with the right competencies, though this metric should be assessed within the context of satisfaction-based metrics like CSAT and NPS.
Number of Calls = (Answered Within the Service Level Threshold / Number of Calls Offered) x 100
5. Average Wait Time/First Response Time
This is another one of our time-related call center KPIs. It measures how long a customer spends, on average, on hold before speaking with someone. The lower this number, the better. Consistently long wait times usually indicate that the call center is understaffed, doesn’t have the right systems in place, or the current team is underperforming – it also means that the service level probably isn’t being met.Average Wait Time = (Total Wait Time/ Total Number of Calls) x 100
6. Average Abandonment Rate
Average abandonment rate tracks how many callers hang up before speaking with someone. It’s one of the most important KPIs for call center performance tracking because a high abandonment rate could point to a range of issues including frustrating phone menus and understaffing, which lead to long wait times and frustrated customers. Today’s time-pressed customers expect quick and convenient service, and they’re likely to hang up if they’re frustrated by the phone menu or feel that they’ve been waiting too long to speak with an agent. This is one KPI that you’d like to see as close to “zero” as possible.
Average Abandonment Rate =(Number of Calls Abandoned / Total Number of Calls) x 100
7. First Contact Resolution (FCR)
FCR is one of the best call center KPIs to track to get a snapshot of your team’s accuracy and efficiency. It measures the percentage of calls your agents can resolve in a single contact without having to follow up – and without the customer having to call back because their issue wasn’t resolved. In other words, FCR measures the percentage of calls that receive ideal outcomes. How quickly the issue was resolved and how well the solution met the customer’s expectations are two of the most important customer satisfaction drivers. If your call center is resolving most inquiries in a single contact and to each customer’s satisfaction, you’re likely to get stellar marks for service. A realistic FCR target is between 70 and 75%.
First Contact Resolution Rate = (Number of Issues on First Contact / Total Number of Issues) x 100
8. Average Time to Resolution
While FCR should be the target, not every issue can be resolved during the first contact. This one of our call center KPI examples is an important metric for assessing how efficiently your team is resolving complex inquiries. Average time to resolution measures how long it takes from the customer’s first call about the issue until the ticket is closed.
Benchmarks vary by industry, but here are some general guidelines:
- Good: < 12 hours
- Average: 12–48 hours
- Poor: 48+ hours
Understandably, some inquiries will take longer to resolve than others – a quick resolution isn’t necessarily the hallmark of good service or a satisfactory resolution.
Average Time to Resolution = (Total Resolution Time / Number of Tickets)
9. Employee Turnover Rate (ETR)
Call center employees are as important as the customers they serve, so it’s important to keep an eye on their well-being. Customer service is a notoriously high-turnover business,. Especially in large teams, the cost of recruiting, training, and onboarding new employees is not insignificant. High turnover can also cause service quality to suffer because veteran reps are spread thin while new hires take time to get up to speed.
ETR measures the percentage of employees who voluntarily resign within a given timeframe. In 2021, the average yearly turnover rate for call center employees was 58%. This is an important figure to keep in mind when setting your target. Watching this metric can help managers identify negative trends and look into what’s driving them. Conversely, above-average retention or rising retention rates could be a clue that your training, coaching, and incentive programs are on point.
Employee Turnover Rate = (Number of Employees Who Left During the Period / Average Number of Employees) x 100
10. Cost per Call (CPC)
Our list of call center KPIs wouldn’t be complete without a financial metric. Companies are in business to make money, and while outstanding customer service is important, keeping costs down is also important. Tracking the average cost per call is one of the most effective ways to optimize staffing levels and keep an eye on operating costs. If your cost per call is higher than you’d like, you might consider looking into self-service tools. In a departure from customer service of the past, toll-free numbers aren’t the automatic first choice – especially for younger customers. Increasingly, customers who are looking for quick answers to simple questions choose self-service tools as their first option. Online knowledge bases containing troubleshooting tips, video tutorials, and FAQs can provide better convenience while reducing operating costs. When calculating CPC, you can choose to only include direct labor costs or also include overhead costs like software licenses, hardware, and office costs for a fuller picture.
CPC = Total Cost of Calls Handling / Total Number of Calls Handled
Plecto can help you get the most out of these KPIs for call center performance!
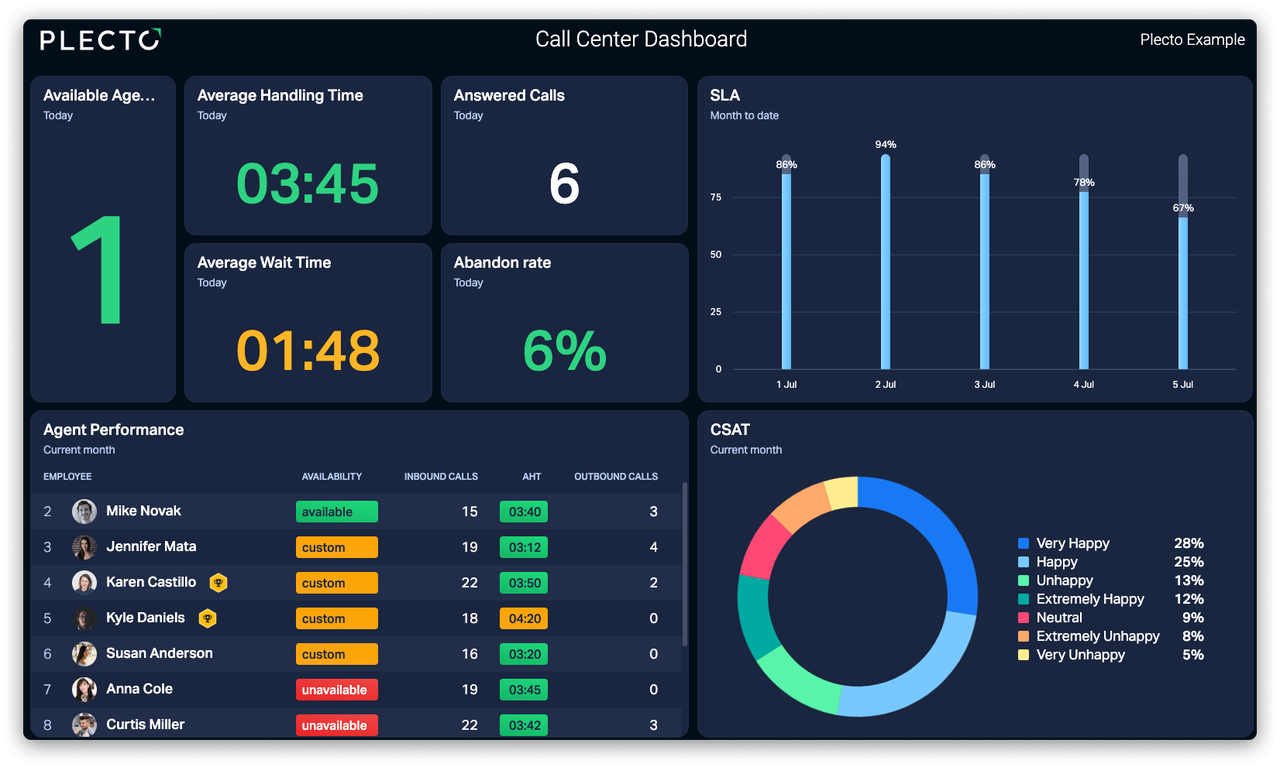
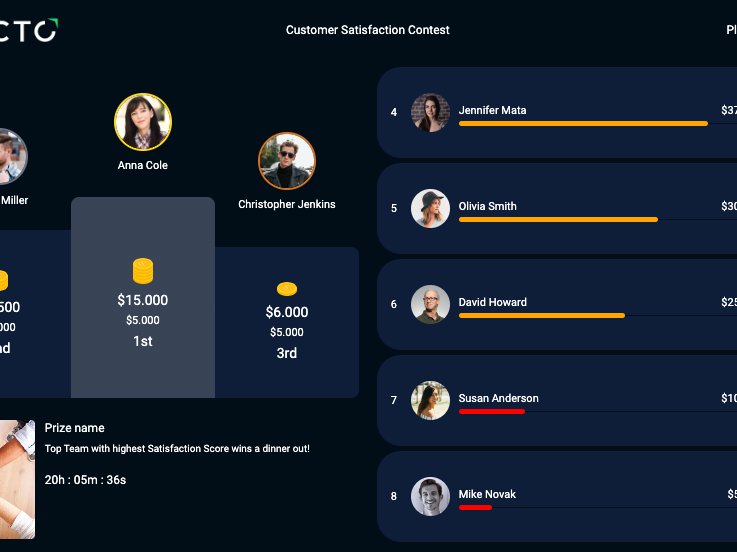
These ten call center KPI examples can help you take a more data-informed approach to your call center’s operations. But that’s only part of it. Call center KPIs are only useful if you actively monitor and act on them. An excellent way to do this is by visualizing the data on dashboards. Plecto’s dynamic dashboards enable reps to switch between individual and team views, so they can see how they’re performing against the team’s averages.
Plecto also offers integrations with popular telephony systems like Aircall, Talkdesk, and Ringover to help call center teams to visualize and track important metrics in real time.
Sign up for a free 14-day trial and see how Plecto can help your call center meet customers’ growing demands for efficient, high-quality service!
