Real estate is one of the world’s most competitive industries, so it makes sense that the use of data analytics for real estate is on the rise, particularly among top-selling brokers. Thanks to today’s technology, real estate brokers are using real estate data analytics to glean insights into market trends, buyer behavior, mobility trends, property values, and more!
5 Key Benefits of Data Analytics for Real Estate
In the past, buying and selling real estate was more of an art than a science. For decades, brokers mainly relied on intuition and sometimes a small amount of retrospective data to inform their decisions. But times have changed, and to survive now and thrive in the future, brokers must accept that today’s real estate industry is still an art – but also a science that requires the use of real estate data analytics to make informed decisions.
Real estate data analytics refers to the process of collecting, analyzing, and interpreting data related to important aspects of the business – for example, accurate property valuations and identifying current market trends. Brokers who understand current and past patterns and correlations are better able to forecast future market conditions, which can help them to better serve their clients.
While the term “data analytics” can be intimidating – big data is optional. Read on to discover five key benefits of data analytics for real estate, which are accessible to anyone who has an internet connection, and enough motivation.
1. More accurate prediction of property values
When it comes to buying and selling real estate, getting a reasonable price is one of the most important factors for both parties. Sellers depend on their broker to sell their property for the best price in the least amount of time. When a property hits the market at the wrong price, it’s difficult to attract potential buyers after the initial surge of interest subsides. After showings have dwindled, the next step is often a price reduction. Most buyers will still want to negotiate down from the reduced price, which often brings a lower selling price than if the listing had been competitively priced from the beginning.
Fortunately, the amount of comparative data at brokers’ fingertips makes it easier than ever to set a reasonable listing price based on past sale prices of properties of similar age and condition, with similar features, accessibility, etc.
2. More efficient marketing
“Personalization” is one of the biggest buzzwords to hit marketing in recent years. This is largely due to easier data accessibility, which makes it possible for marketers to create razor-sharp customer segments and target them with the exact products and services they need – sometimes before they even know they need them.
Top brokers are using these 15 very effective real estate lead generation tactics. And many are also using real estate data analytics to drive personalization by looking into their book of business and segmenting past customers based on their demographics and preferences. Using this information to create personas can help them more accurately identify suitable buyers for current and future listings. Paid social media advertising is becoming increasingly instrumental in driving real estate sales, and understanding attributes like the preferences, requirements, financial situations, and geographical characteristics of people who have bought similar properties makes it easier to effectively target an interested audience.
This is also a useful tactic for securing new listings. Data points related to mortgage status, home equity, and how long the owner has lived at a property can all help to identify potential sellers when analyzed in the context of past sellers. Furthermore, understanding the core attributes of why past properties have sold can help with lead generation and creating compelling case stories showcasing why prospects should choose one broker over another.
Build your first dashboard.
Start your 14-day free trial today

3. Better understanding of market trends
The best brokers are usually experts in understanding every factor influencing a property’s value and investment potential. They’re successful because they know the business inside and out, and they’ve built their reputation on that expertise. Like most other industries, real estate has become more complex and competitive in recent years. What was true in the market three months ago might not be true today. Understanding the state of the market at this moment, along with other contributing factors such as interest rates, places brokers in the best position to competently advise their prospects and clients on when and where to buy and sell property.
4. Better knowledge of competitors’ activities
Success in real estate is dependent on the broker’s ability to attract and serve both buyers and sellers. Therefore, like most industries, it’s important to keep tabs on competitors. With data analytics for real estate, brokers can keep track of which companies and brokers are listing and selling the most, how they rank for customer satisfaction, and more. This information combined with an audit of their competitors’ marketing activities can help brokers be more competitive and have a better chance of outpacing their rivals by studying their playbooks – and improving upon them!

5. Faster business growth
A strategic and ongoing use of real estate data analytics should drive business growth. Realistic pricing, a market-driven approach, and targeted marketing should translate into faster sales, better customer satisfaction, and higher revenue. There’s no doubt that brokers who choose to invest time and effort in understanding and using data analytics as their modus operandi sell more efficiently than brokers who don’t. Today’s technology has made nearly every industry more data-driven, and many have reached a tipping point where it’s necessary to move with the times or be left in the dust – and real estate is no exception.
To get the most out of your data, visualize it!
There’s little doubt that real estate data analytics can help to improve performance and increase profitability, but data is only useful when it’s used. One of the biggest barriers to regular and successful use of data analytics is unnecessary complexity, which creates a high dread factor that outweighs even the most motivated brokers’ best intentions.
To get over this stumbling block, many top brokers visualize their data in real-time dashboards and reports. Fortunately, the data revolution has brought with it easy-to-use visualization tools. These tools provide the ability to create set-and-save reports, which can automatically translate visually unappealing data into attractive visual formats that make it easy to understand – and more likely to be used. Some solutions also offer automated reporting tools to ensure that you always have the most up-to-date information, which can be exported to presentation-ready PowerPoint or Excel files in just a few clicks.
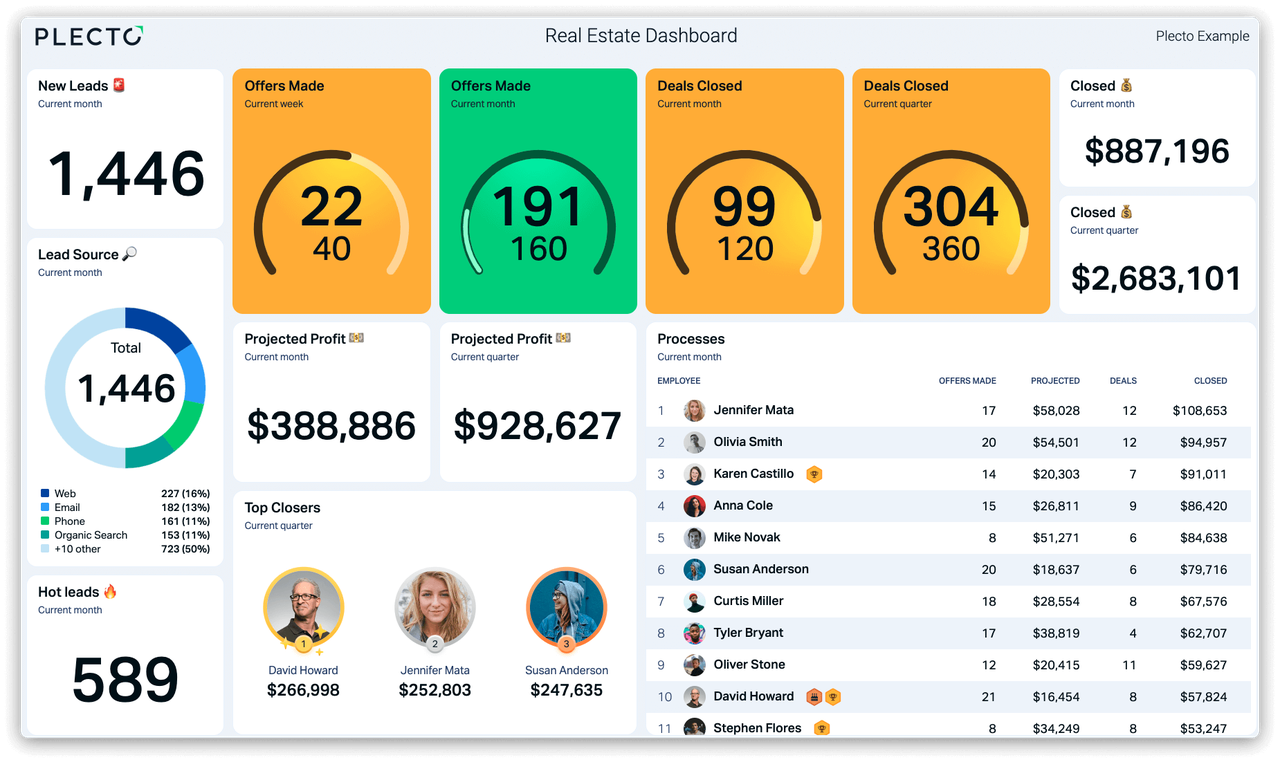
Dashboards are another visualization tool that makes it easy to distill bland but important information into a visual format that makes it more interesting and easy to understand. Dashboards are an excellent tool for visualizing performance against KPIs related to activities, pipeline, leads, and more. Many brokers find it helpful and motivating to visually track performance-focused metrics like appointments booked, offers made, contracts signed, projected sales, and commission won.
Plecto offers a range of visualization tools for ambitious real estate brokers – and a free 14-day trial.


