The e-commerce market continues to grow rapidly and it is forecasted that there will be 2.64 billion online buyers in 2023. Tracking e-commerce metrics can help you gauge whether you are meeting your goals. Additionally, each different e-commerce KPI can provide valuable insights about your online business performance and identify areas for improvement. In this blog post, we collected the 15 most needed KPIs which will ensure your e-commerce business success!
How do you choose which e-commerce KPIs to track?
Regarding defining which e-commerce KPIs to track, it is important to align them with your business's goals and objectives. For example, your goals could be:
- Increasing annual sales by 10%;
- Gaining 15% more new customers in 6 months,
- Decreasing customer churn by 5% in 12 months.
Once you have your goals, you are now ready to set your KPIs so you can measure your progress. There are hundreds of different KPIs for e-commerce, so it is important to select the right ones. Trying to track all e-commerce KPIs can be overwhelming and will not yield the desired results. To achieve optimal results, there is no magical number of KPIs that you should track, just make sure that are not too many!
15 e-commerce KPIs you should measure
Don’t get lost while selecting which KPIs is important for you, we have picked the most needed KPIs for your e-commerce business!
5 sales KPIs for e-commerce
Shopping Cart Abandonment Rate (SCAR)
The shopping cart abandonment rate measures the percentage of online shoppers who add items to the cart but leave the website without completing the purchase. This rate represents the amount of potential revenue that an e-commerce company is losing. The average rate of cart abandonment, according to research by the Baymard Institute, is 69.99%. Reasons for abandonment can vary, but the most common include unexpected expenses during checkout, the necessity to create an account, or a longer delivery time.
Average Order Value (AOV)
Average Order Value (AOV) is the average amount a customer spends on a single purchase. The AOV rate can help you determine customer behavior and trends. Providing you with precise information about your customers tracking the AOV rate will help you improve your promotional and pricing strategies. Evaluating AOV is more than simple: an increasing AOV rate indicates that customers are spending more per purchase, in turn boosting your revenue. However, if your AOV rate is decreasing or is not what you want it to be, here are some tips on how to increase it. For example, you can offer free shipping for a certain amount of money, create bundle options, or set up a loyalty program.
Cost of Goods Sold (COSG)
In e-commerce, the Cost of Goods Sold (COGS) measures the total cost of goods that have been already sold. If you want to expand your e-commerce business, you must keep an eye on your expenses and optimize your pricing decisions based on the current market conditions.

Repeat Purchase Rate (RPR)
Repeat Purchase Rate (RPR) refers to the number of customers who make a purchase more than once. RPR indicates actual customer loyalty and engagement with your e-commerce. RPR rate also affects Customer Lifetime Value (CLV), as increasing RPR also boosts CLV value. Optimizing the RPR rate will guarantee the long-term success and growth of your business!
Conversion Rate (CR)
The Conversion Rate indicates the percentage of website visitors who convert into actual, paying customers. This rate can be used to track the impact of marketing campaigns, your products, or site design.
Build your first dashboard.
Start your 14-day free trial today
5 marketing KPIs for e-commerce
Traffic Source
The Traffic Source KPI measures the origin of website visitors. It provides a insight into which channels are the most effective, whether it’s organic search, paid search, social media, or referral traffic. This will allow you to maximize your marketing efforts and determine the most effective channels for your business.
Bounce Rate
The Bounce Rate is one of the most needed KPIs for e-commerce in the marketing field. This metric tracks the percentage of visitors who left the website after only viewing one page and did not take any further action. A bounce rate of 25%–40% is considered acceptable. Tracking the Bounce Rate will assist you in identifying and optimizing your website.

Return On Ads Spend (ROAS)
This metric measures the efficiency of online advertising campaigns. If ROAS is high or increasing, it means that ads are effective, which drives sales and revenue growth. Targeting the right audience, following trends, and creating engaging content can all improve the ROAS rate.
Email Open Rate (EOR)
The Email Open Rate shows the percentage of customers who opened that particular email. A high open rate shows that the email subject line was engaging and relevant to the targeted audience. To increase EOR, use personalized e-mails, send them at optimal times of the day, and provide valuable, well-written content.
Time On Site (TOS)
Time On Site measures the average amount of time your visitors spend on your site. It gives an overview of visitor engagement and experience with your site. Loading times, engaging content, and a user-friendly interface are all factors that influence Time On Site.
5 Customer Service KPIs for e-commerce
Customer Satisfaction Score (CSAT)
The CSAT score assesses how pleased your customers are with specific experiences with your company. For example, it could be a question: "On a scale from 1 to 10, how satisfied are you with your shopping experience today?". By monitoring this KPI you can improve customer experiences and retention, leading to loyalty!
Net Promoter Score (NPS)
Word of mouth is one of the best ways to advertise, and the NPS score measures customer loyalty and how likely they are to recommend others about your e-commerce business. You can improve your NPS score by improving product quality, responding quickly, and delivering faster!

Hit Rate
This indicates the number of customers who contacted support about the same product. It can aid you in determining which products are confusing regarding usage, appearance, or description. This will help you in investigating problems and providing the best value to your customers!
First Response Time (FRT)
This e-commerce KPI is especially important. Customers may encounter a whole range of issues, such as shipping, returns, or general product questions. This KPI measures how long it takes for customers to receive their first response from the customer service team. Remember that a quick first response time makes customers happier, keeps them coming back, and could even boost sales!
Average Resolution Time
Shopping online often leaves the customer with questions.. The Average Resolution Time shows how much time it takes for the customer service team to solve customers' issues.

Make data-driven decisions with Plecto!
E-commerce is one of the most competitive industries and you need to view all the processes under one umbrella to ensure success. Choosing one or another KPI is not enough; you need to identify where your business needs to improve! Setting clear goals will help to identify the right e-commerce KPIs, which will help to employ data-driven decisions!
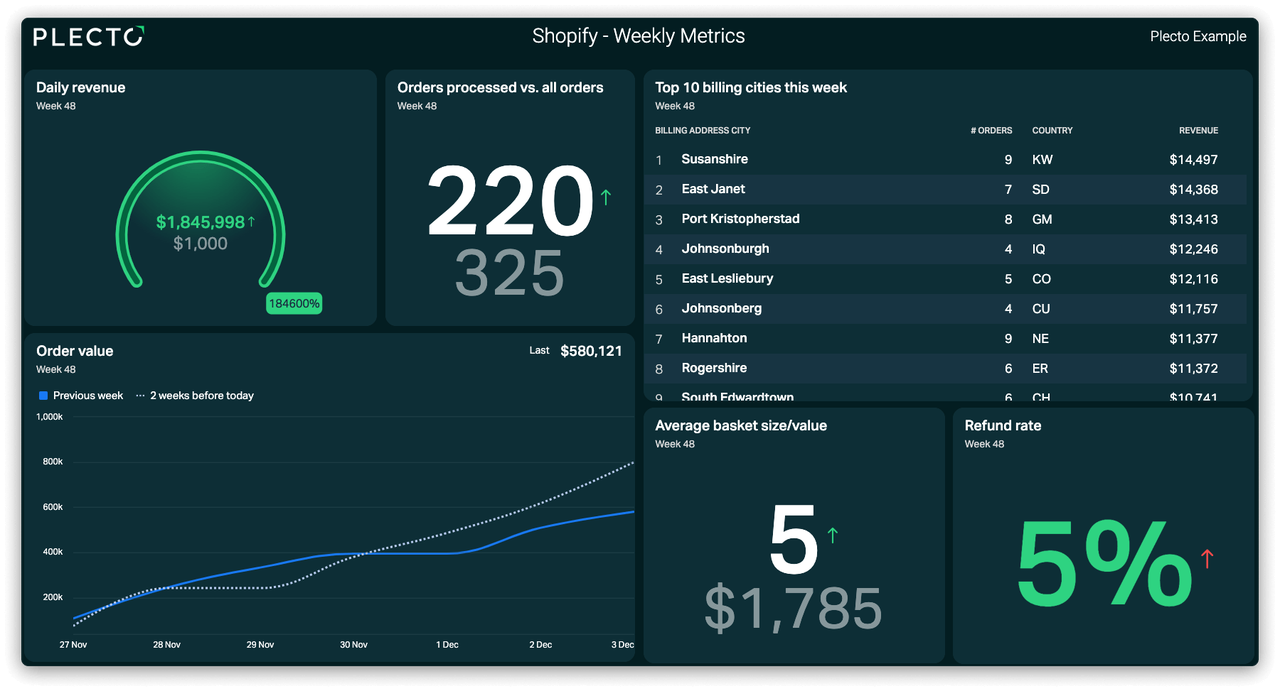
Boost your e-commerce store sales with Plecto’s Shopify integration! This powerful duo will boost your e-commerce sales and increase customer engagement, which will move your online business to the next level! You will be able to track your sales performance, monitor customer behavior and stay ahead of the competition, empowering you for long-term e-commerce success!
Sign up for a 14-day free trial to see how real-time dashboards and e-commerce KPIs can help your business!


