Get inspired with our dashboard examples for the sales and service departments of security companies.
Who looks at it
The sales and service departments of security companies.
Focus area
Frontline sales and support staff in security businesses.
Purpose
Boosting sales and improving customer service.
What integrations are used


In line with the surging demand for home security products in recent years, the industry has seen two major changes. First, the shift toward a subscription-based model, and second, the need to stand out amongst the highly concentrated, competitive market. Tracking the KPIs to improve the customer experience is key to addressing both.
These dashboard examples cover the sales and customer support KPIs in the security business, plus high-level metrics for managers. Use them to simply show reps their KPI contributions, identify challenge areas and adjust accordingly – or identify incredible performance and recognize these individuals in real time!
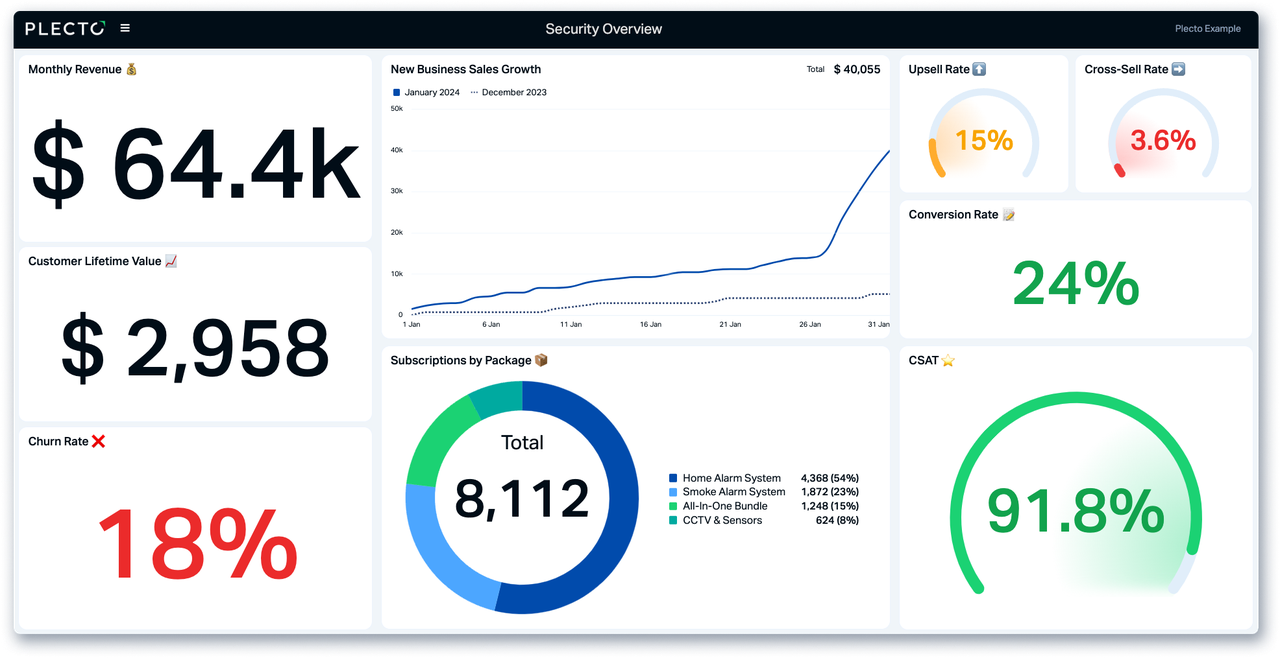
This first dashboard focuses on top-level financial KPIs related to subscription management that you can replicate in the same way. Use simple number boxes to display your business-critical metrics such as monthly revenue, customer lifetime value, and churn Rate. A donut chart is used to get a deeper insight into what products are selling the most.
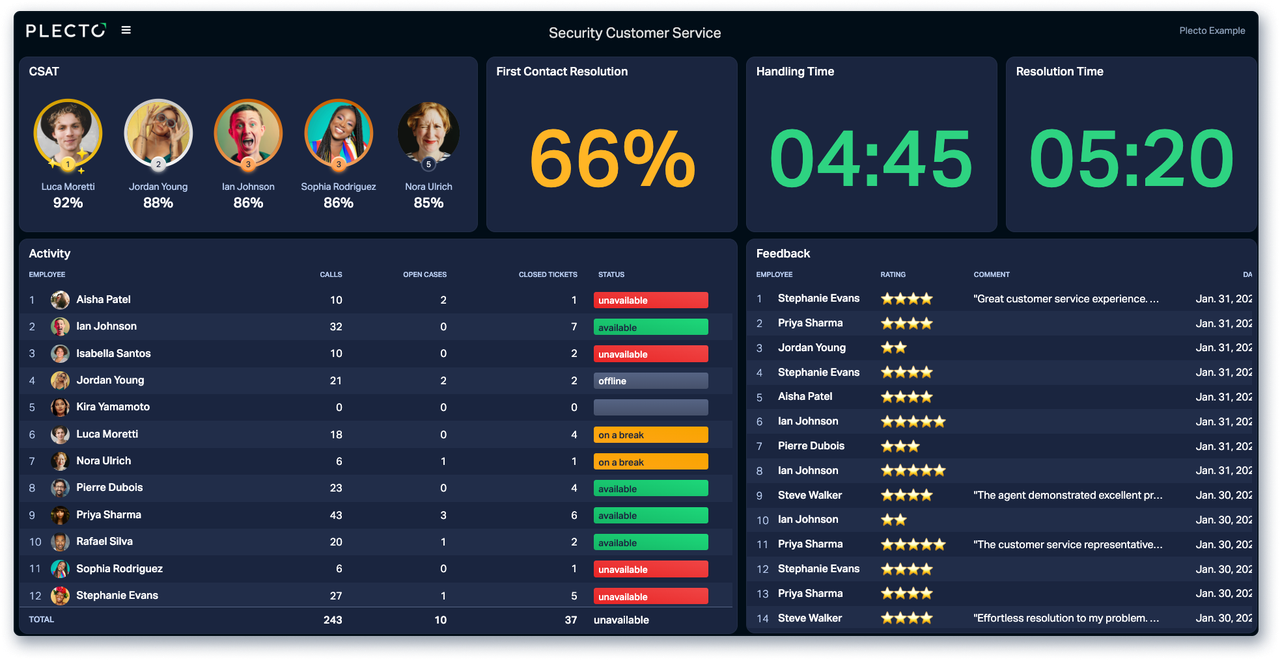
Focus on the metrics that matter to satisfaction and retention. Put your CSAT champions on a leaderboard to encourage the whole team to take the top spot. Keep an eye on calls, open cases, and closed tickets in a table that makes it simple to see where and who might need extra attention. Create a superb customer experience that will stop them from switching to your competitors by tracking and improving your handling and resolution times with ease.
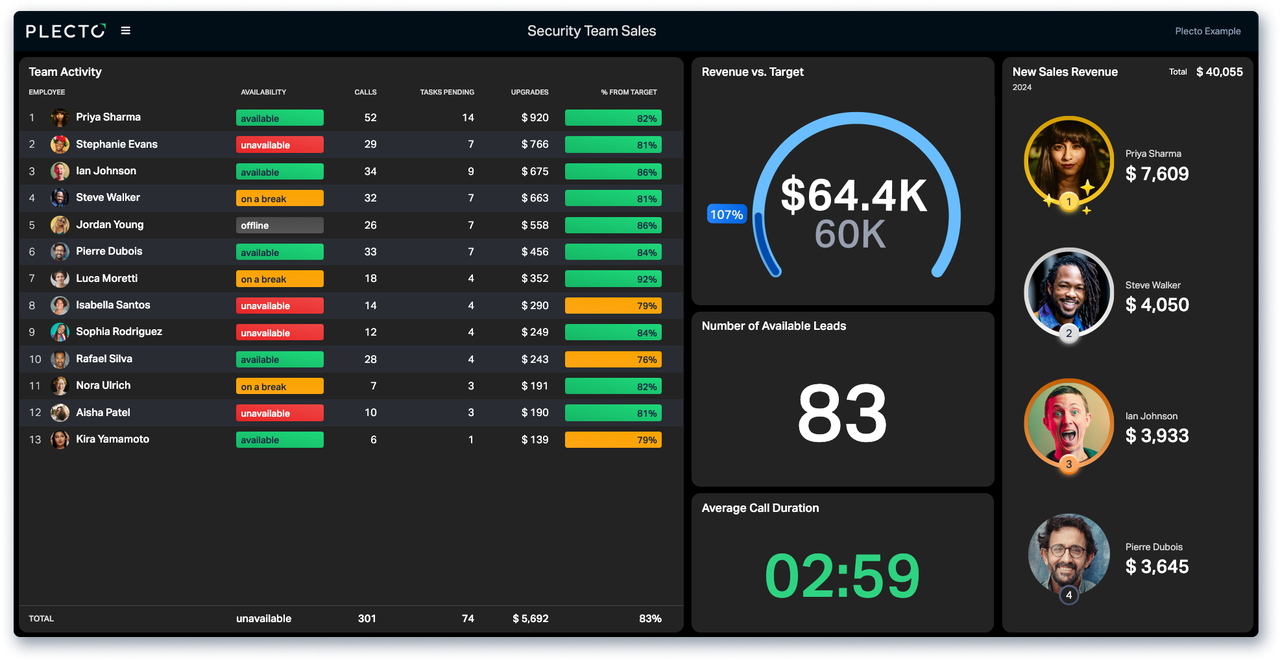
See your team's sales activities in seconds as you focus on short-term sales activities that your team does every day – so you can make the right adjustments to achieve your long-term targets. Want to know whether you're lacking in leads, not making enough upgrades, or have tasks stuck in the pipeline that are wreaking havoc on your revenue? Pinpoint exactly that and more with perfect sales for both your team and you as a manager!
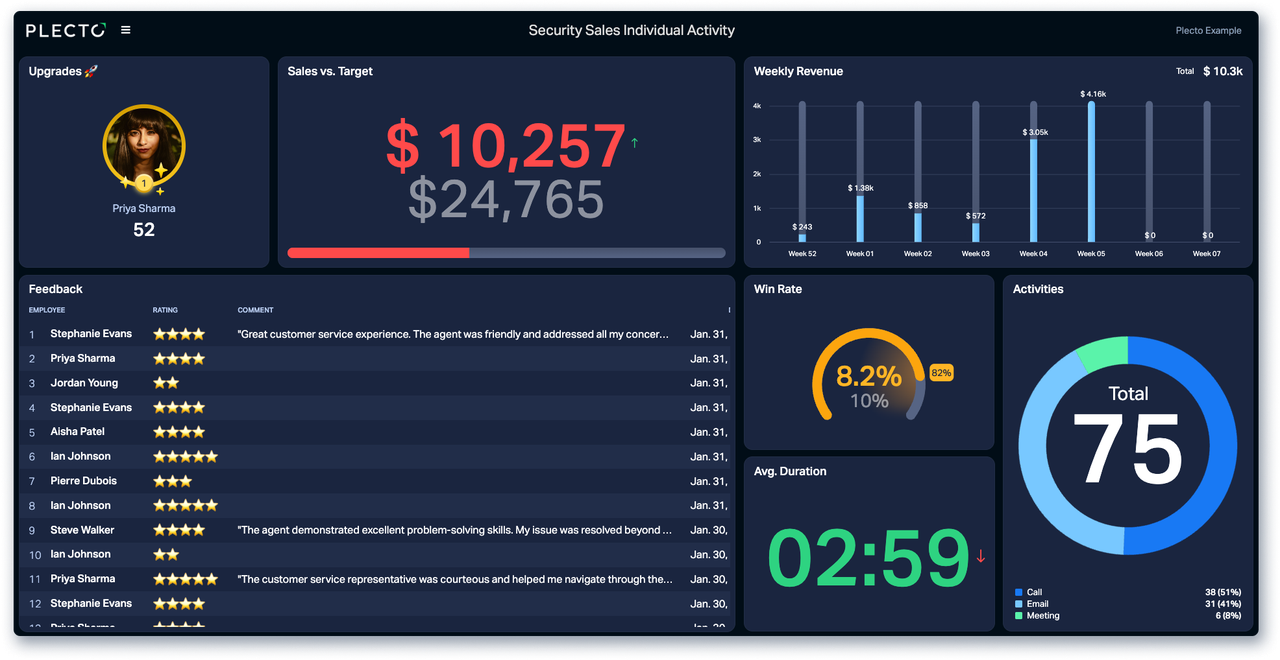
Easily see each employee's valuable contributions to team targets with this individual sales activity dashboard. The best part? You can toggle to see these KPIs from a team view or for each sales rep. Watch your win rate soar toward the target on a speedometer, and get a breakdown of weekly revenue and activities. Drill down on everyday activities like feedback scores to address any negative ratings or recognize your rep's customer service excellence!
Improve productivity, align on your KPIs and maximize the motivation of your agency.
Performance dashboards tailor-made for the fast-paced, high-activity world of telecommunications sales and customer relations.
Adopt an actionable, data-driven approach to your agency with real-time insurance dashboards.