Stop relying on whiteboards and delayed reports. See jobs, revenue, and technician performance live — on TVs, mobile, or desktop. Make faster decisions, prevent overbooking, and keep your teams aligned all day.
Who looks at it
These dashboards are built for call handlers, technicians and managers of HVAC businesses.
Focus area
Technicians and support staff.
Purpose
Increasing data transparency across the business.
What integrations are used
In the trades, you can’t wait hours for reports.
Plecto connects directly with ServiceTitan and gives you live visibility into calls, jobs, revenue, and technician performance — all on dashboards your team actually uses.
You see what’s happening the moment it happens, so you can fix issues fast, keep schedules on track, and motivate your team with real-time feedback.
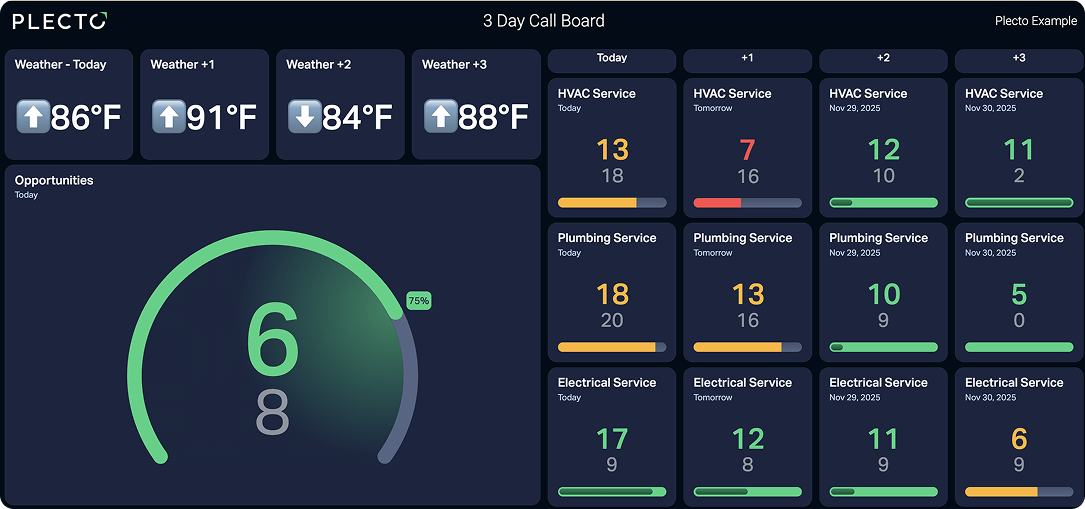
The Call Board shows dispatch exactly what’s booked, what’s open, and where the gaps are across today and the days ahead. No manual whiteboards, no report pulling, no delays. Your team can make booking decisions instantly—avoiding overloading techs, preventing last-minute reschedules, and keeping the schedule tight and balanced throughout the day.
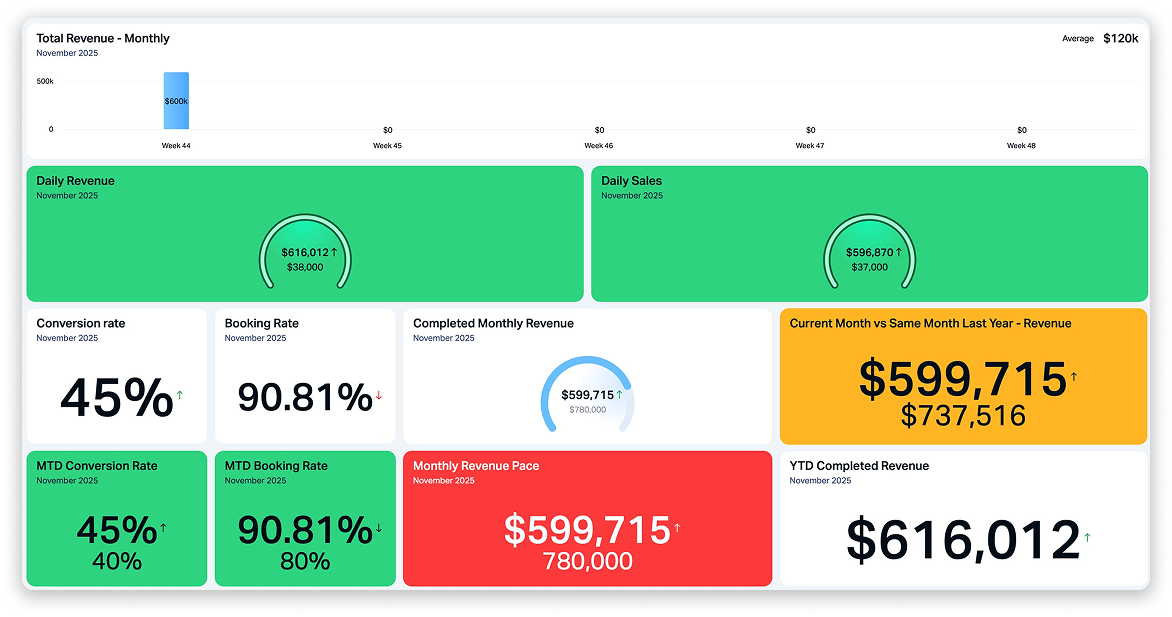
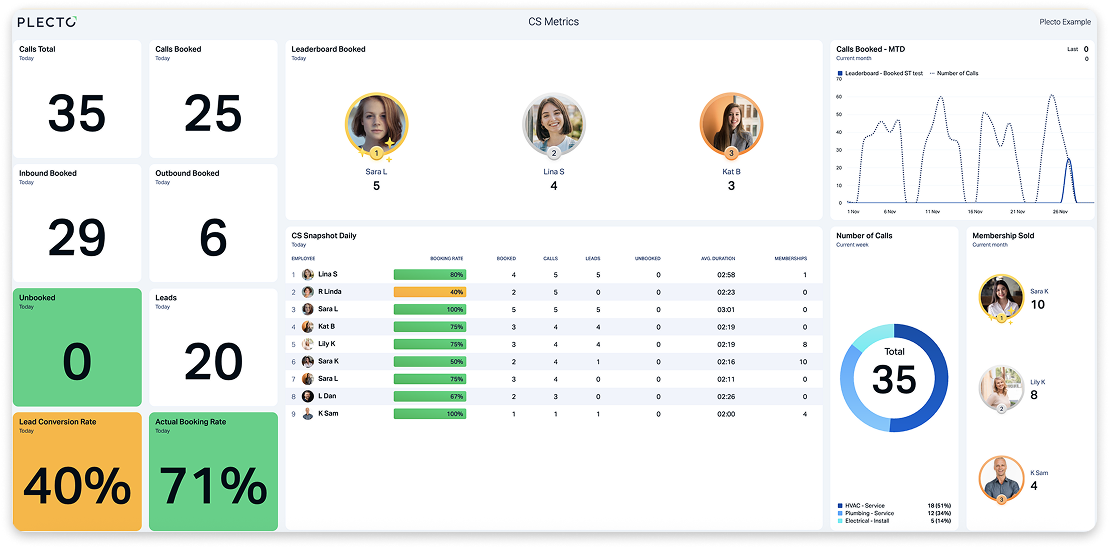
The CS Metrics dashboard gives your call center a live view of booking rates, missed calls, hold times, and call outcomes. Instead of waiting for next-day reports, managers and trainers see exactly where calls are being lost and can step in while the day is still recoverable.
Your team gets clear, real-time feedback on how they’re doing, shift by shift. That means faster coaching, fewer missed opportunities, and more calls turned into booked jobs — not just logged interactions.
"You can change and coach in real time — you catch issues instantly instead of waiting a day or two for reports."

Jen Johnson
Administrative Manager, Arnold & Sons Plumbing
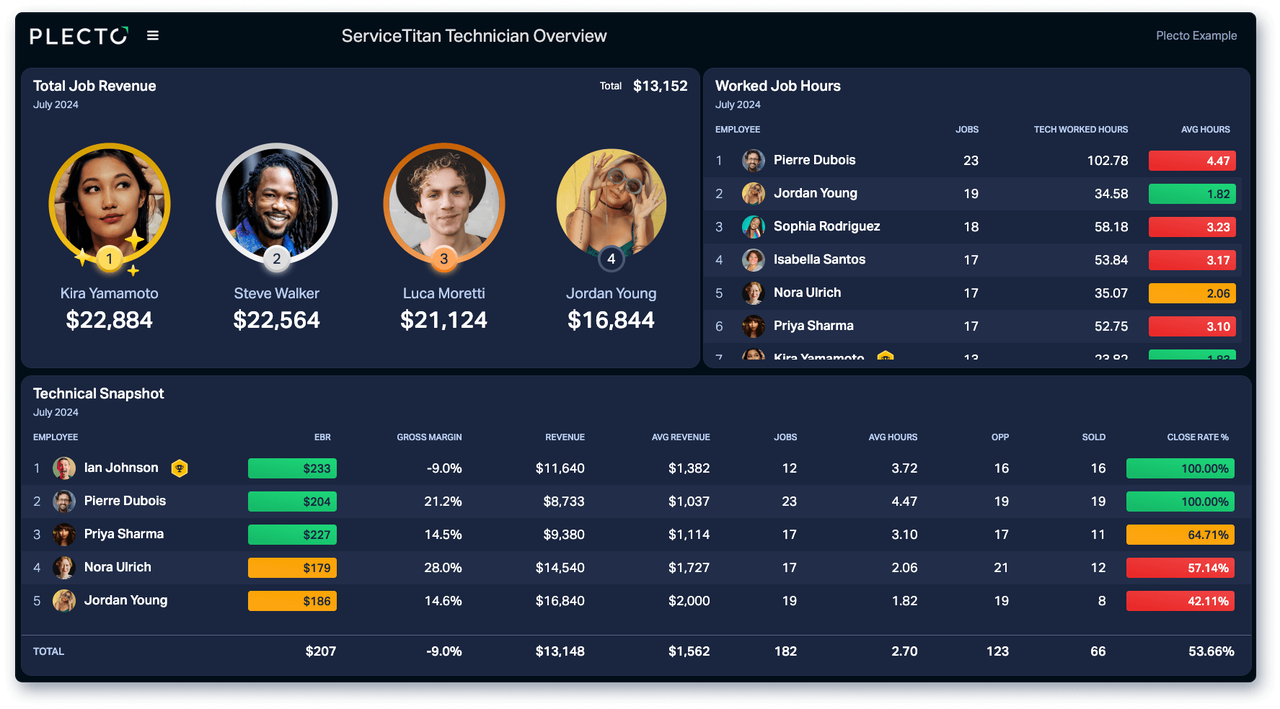
The Technician Overview dashboard shows exactly how every tech is performing throughout the day — jobs completed, revenue generated, efficiencies, and key service KPIs. Managers don’t need to chase down updates or wait for end-of-day reports; everything is visible the moment it happens.
It keeps techs accountable, helps identify who needs support, and gives high performers the recognition they deserve.
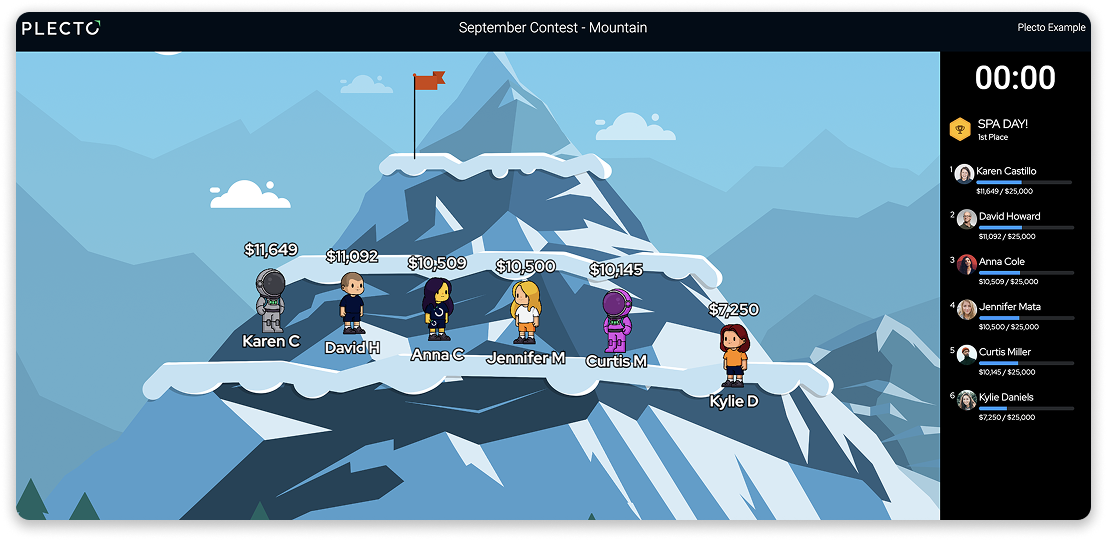
Contests turn daily KPIs into motivation. Every job, sale, or upsell moves techs up the board, giving them clear goals and instant feedback. It keeps energy high, builds healthy competition, and drives consistent performance across the team.
"Gamification is taking our performance to the moon! By turning surge protection and 12-point inspections into a team sport, we’re seeing record-breaking sales, $2,000 bonuses, and a culture of healthy competition that’s absolutely electric."

Robert Boyles
Training Manager, Electrika
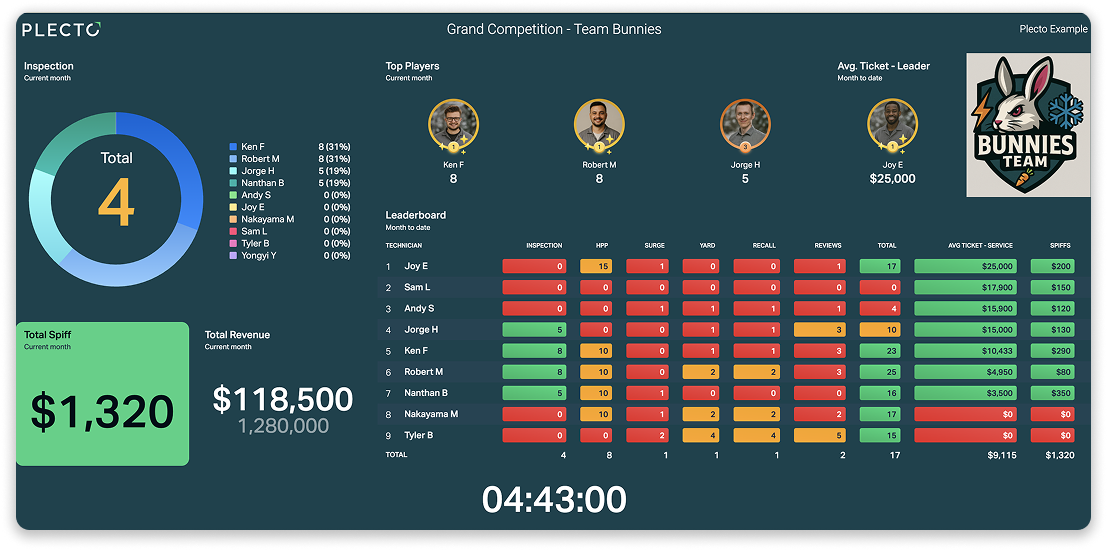
A real-time leaderboard shows exactly how each tech is performing — jobs completed, revenue, upsells, and efficiency. It makes accountability visible, highlights top performers, and helps managers spot who needs support without waiting for end-of-day reports.
"Plecto definitely contributes to technician efficiency — they want to be more productive and generate more for the company and themselves."
Rick Gallardo
General Manager, Drain Right Services
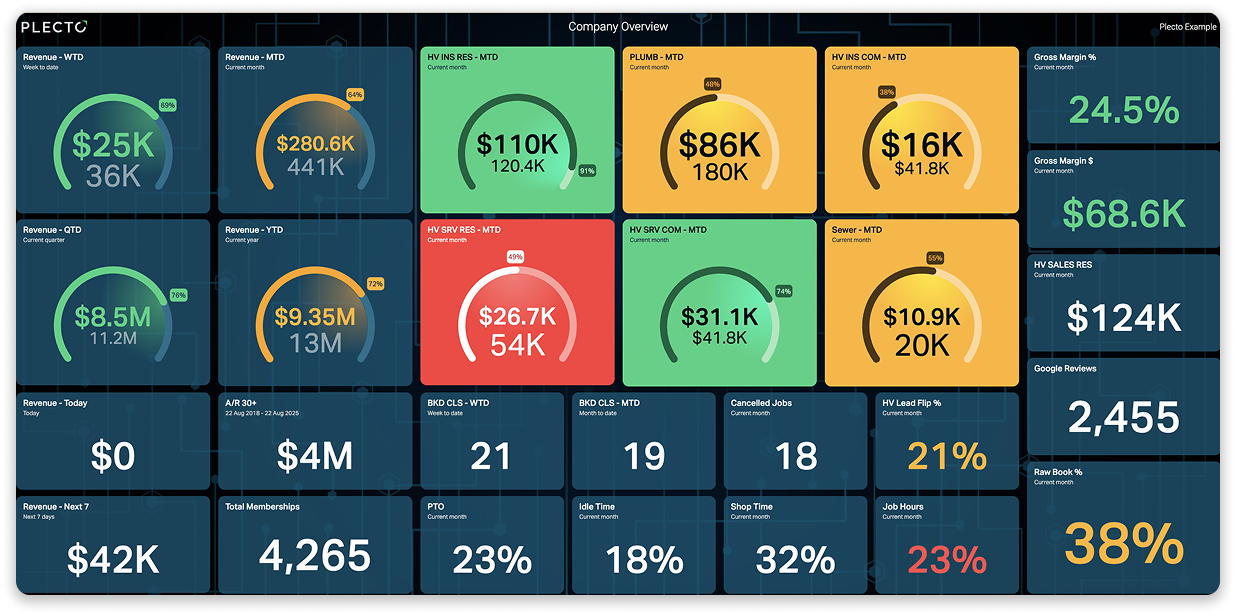
The Company Overview dashboard gives leadership a real-time snapshot of revenue, jobs, performance, and key KPIs — all in one place. It replaces scattered reports with a single view of how the business is running right now.
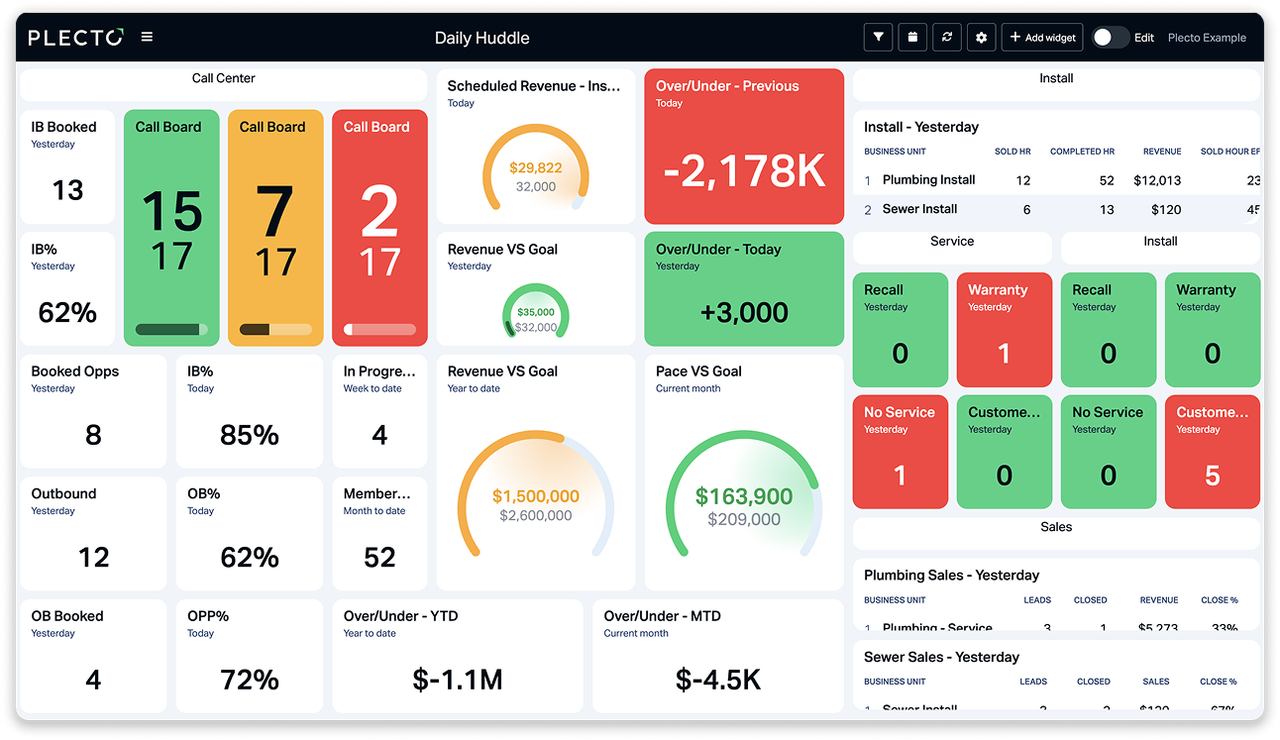
The Daily Huddle dashboard gives your team a fast, focused snapshot of what matters most — yesterday’s results, today’s workload, and the metrics that need attention right now.
It keeps everyone aligned before the day starts, highlights where support is needed, and gives managers a clear plan of action without running reports or digging through ServiceTitan.
"The Plecto board is where technicians go in the morning — it’s kind of the new coffee machine or the water jug."
Rick Gallardo
General Manager, Drain Right Services