Get real-time, data-driven insights into your retail performance.
Who looks at it
All members of the store team.
Focus area
Gives your team insight into how much money you're making.
Purpose
No team member is left in the dark regarding their KPIs.
What integrations are used
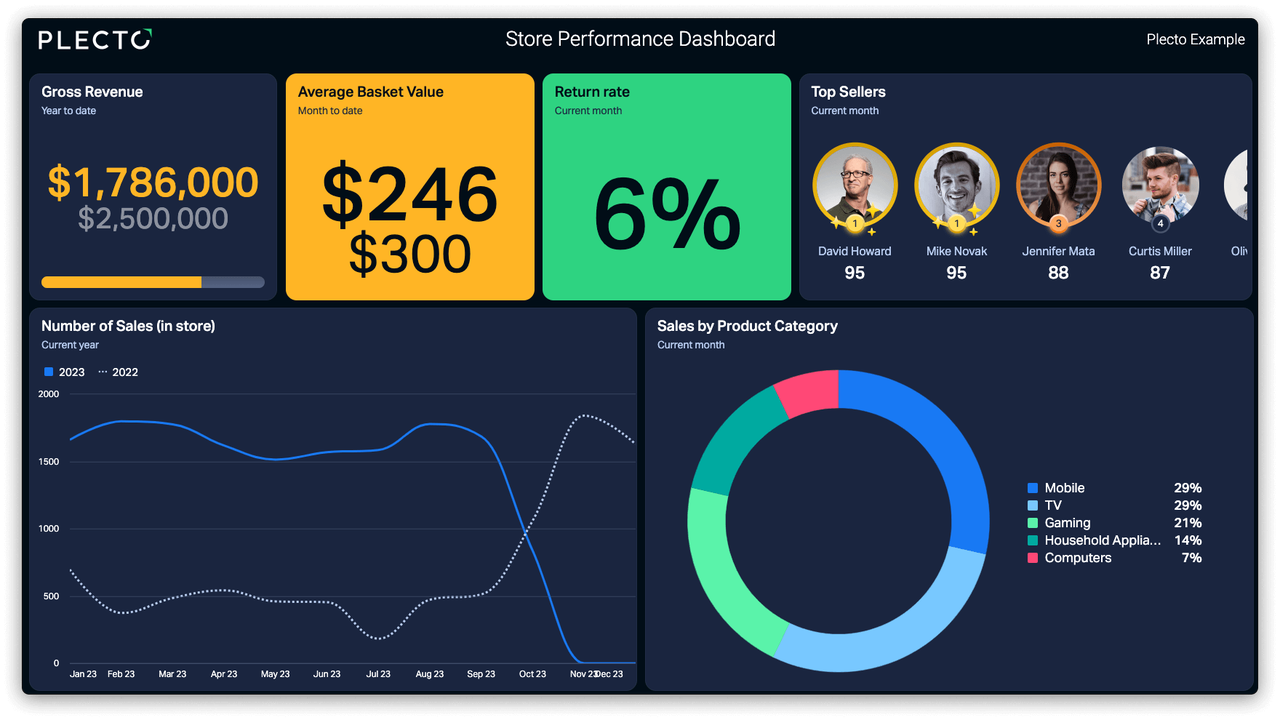
Store performance dashboards track the progress of physical, retail stores. In this example, we focus on a store that sells electronics, but of course the KPIs used here can easily be applied to other retail sectors.
This dashboard helps store staff stay up to date with key questions such as:
This dashboard is designed to provide a quick snapshot into your store's performance. To get deeper insights, check out our reporting feature where you can get more extensive analysis.
Retail is a data-driven business, and store performance dashboards enable retailers to know exactly what's happening their data. This dashboard gives teams the breakdown of which of your inventory sells the most. As a result, this enable retailers to better focus your efforts on what's driving the most revenue, and adjust your strategy as a result.
Sure, it's crucial to stay on top of what's selling, but it's just as important to get the overview of which of your team members are selling the most.
In busy retail environments, sales numbers and other key performance indicators can easily be overlooked amidst the busy hustle and bustle of the shop floor. Introducing gamification on your dashboard helps rectify this. For example, set up instant notifications so that whenever a team member has made a sale, the whole team is aware of it.
If you're like many retailers, then you will combine your physical stores with an offsite contact center for customer support. With Plecto, there is no limit to the number of dashboards you can create, meaning you can have dedicated dashboards to all areas of your operations.
This makes it a great way to boost synergy between your brick-and-mortar store and the office site call center. Want to learn more? Discover the success stories of Danish clothing retailer Shaping New Tomorrow and Swiss telecom giant Sunrise.
KPIs on a Store Performance dashboard really depend on where your focus lies. We recommend getting a good balance between operational-level and employee-focused metrics.
Crucial to your retail operations, this KPI measures the total sales income before any deductions have been made.
The average value of each customer's in-store purchase.
The percentage of purchased products that are returned by customers.
Simply put, measures who on your team is selling the most.
Measures the raw number of sales. Ideal when you want compare current performance to a previous time period.
This KPI identify how product sales vary by category.
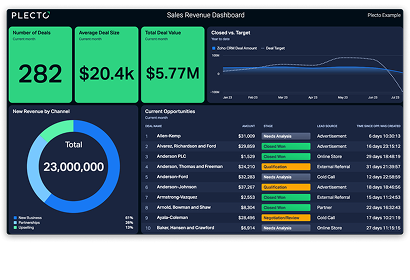
Identify where the new business is coming from with a real-time dashboard for tracking sales revenue.
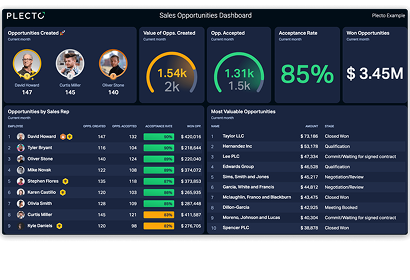
Get full insight into your sales pipeline with real-time sales opportunities dashboards.
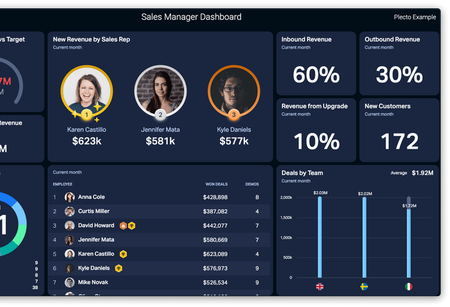
Smash your sales targets with a sales manager dashboard. Get actionable insights into your team’s performance at a glance.
No credit card required.