What is the Rate of Return?

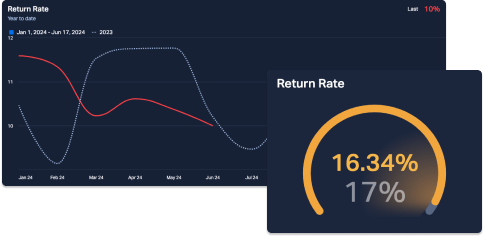
Rate of Return (RoR), also called Return on Investment (ROI) compares an investment to its gain or loss over time, expressed as a percentage of the original investment. A positive RoR indicates the investment has increased; a negative RoR indicates the investment has lost value.

Investments can consist of any number of assets, including but not limited to stocks, bonds, real estate, and fine art.

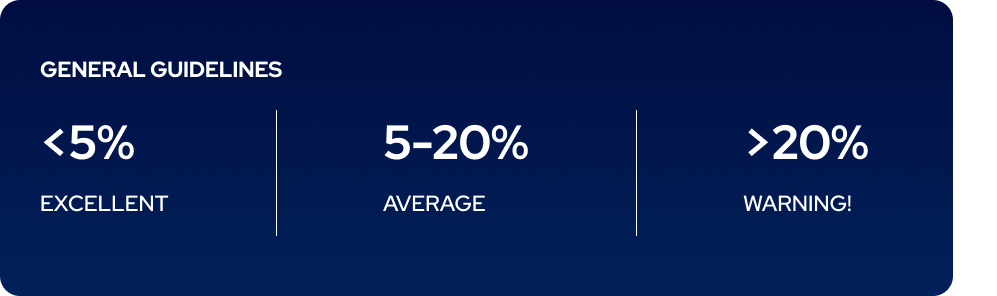
Rate of Return for your company’s assets is an important KPI for your finance team to monitor.

Why is the Rate of Return important?

Rate of Return is one of the foundational metrics of financial analysis. It’s a simple measure that nonetheless reveals a great deal – are your investments actually paying off? Calculating a Rate of Return will allow you to see if you’ve wisely chosen assets to invest in. It can also help you determine the appropriate course of action for a major financial decision.

For example, suppose you want to relocate your company headquarters and sell your current building. By calculating the RoR on your real estate from its initial purchase value to its current value, you’ll be able to determine the gain or loss to the property value and plan for the future accordingly.

How to calculate Rate of Return

To find RoR, subtract the initial value of the asset from its current value. Divide the result by the initial value, and multiply this answer by 100 to obtain a percentage.

rate of return formula.png

Best practices for Rate of Return

The best practice for Rate of Return is, naturally, to make high-yielding investments. A good annual RoR is considered to be 7 percent, per the inflation-adjusted yearly rate of the S&P 500.

Important! One of the key flaws in RoR is that it does not account for inflation over time. To incorporate this factor into your calculations, use the real RoR metric.

Other KPIs similar to Rate of Return include:

Supported integrations
Salesforce Salesforce

How it works

1. Connect your data sources

One-click real-time integration with our dashboards to the most popular CRM, support and other business systems.

See our integrations

2. Build dashboards

Use our prebuilt KPI dashboards or customize your own by using formulas to calculate more advanced metrics.

Learn more about our dashboards

3. Boost team performance

Share real-time insights with your team and boost performance by 20% with visualizing data on dashboards.

Read our customer stories

Boost performance with real-time insights

Plecto is a data visualization software that helps you motivate your employees to reach new limits and stay on top of your business.