Join 700+ data-driven companies already taking their performance to the next level

Identifying insights on real-time dashboards

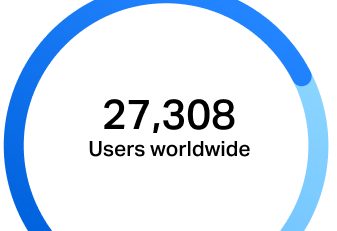
See your subscriber growth live in seconds

Is your team on track to reach your target total subscriber growth? Sales team smashing your upsells? Simply see each employee's and team's target progress by centralizing and visualizing all your media data in one place – on dazzling, real-time KPI dashboards.

See your KPIs on live dashboards

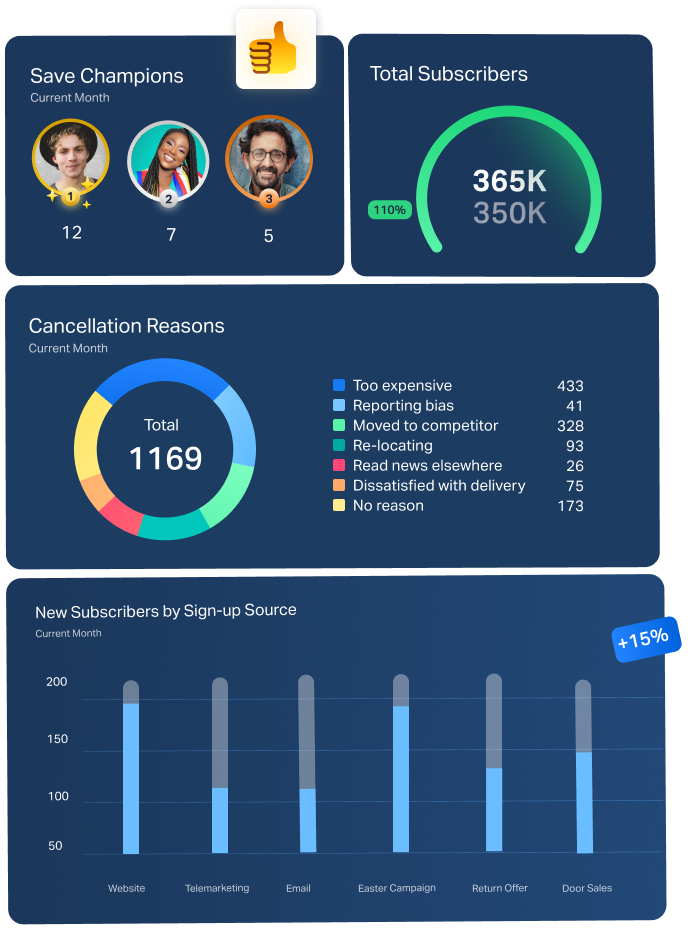
Crush your service and satisfaction

See your customer service channel queues in real-time on simple live dashboards. Identify when and where your busiest channels are, schedule accordingly, and ace your customer service! Showcase your CSAT champions on leaderboards for extra motivation!

See more customer service dashboard examples

Gamification for modern media teams

Instant Notifications for Customer Service teams

Live notifications for real-time recognition

Give some kudos to your customer service champions when they save a customer from cancelling with instant notifications that you can set-up to displays on TVs around the office.

Insurance CSAT Contest Image.png

Contests for CSAT and sales champs

Get your employees excited about work with a little friendly competition. Run a CSAT, upgrade, response time, partner sales, or new business contest to get your team competing on the same KPIs.

The Insurance Surgery Logo

Matt Vickers

Operations Manager at The Insurance Surgery

"Our sales reps love Plecto. They're turning to the dashboards to see how everyone's going, and waiting for the notification when someone makes a deal. You can drive friendly competition, so it works for everyone!""

REMA 1000 Logo.png

Lennart Thomsen

System Responsible at REMA 1000

"Our response time has improved a lot since using Plecto. We went from around 5 or 6 minutes to at times half a minute, and approximately 3 minutes now.""

If Forsikring Danmark Logo.png

Daniel Toft

Outbound Sales Team Leader at If Forsikring

"Since introducing Plecto, people have been more engaged, and have been competing a lot more than we used to. Our reps are reaching out a lot more to each other, and saying 'OK, I will sell more than you today,' for example."

Customer Success Stories

JFM Hero Image.png

Discover how this media giant achieved alignment toward the same targets with real-time data dashboards.

Read JFM's media success story
Insurance_Surgery landing page case study

The Insurance Surgery boosts lead generation calls by 50% with Plecto x Aircall integration – visualizing real-time call metrics made easy!

Top UK insurance team shares their story
If Forsikring landing page

Learn how IF Forsikring uses Plecto’s gamification features to supercharge the engagement and motivation of their employees.

Read IF Forsikring's story

Get inspired by these common media KPIs

Recurring Revenue

Tracks the revenue that you continuously generate from existing subscribers.

Subscriber Renewal Rate

Refers to the number of subscribers you've retained from one billing period to another

Acquisition Cost

Know how much it costs to find and attract new customers

Number of Referrals

Measures the number of customers who were referred by existing subscribers.

Value of Cross-sells

The revenue generated from existing customers buying supplementary products

Average Revenue per Subscriber

As the name suggests, the average amount of money paid by each customer

Discover more: Read the full guide to calculating and boosting customer lifetime value

Let the numbers do the talking...

Dashboards Created Speedometer (Plecto in Numbers).png
Countries Speedometer (Plecto in Numbers).png
Users Worldwide (Plecto in Numbers).png